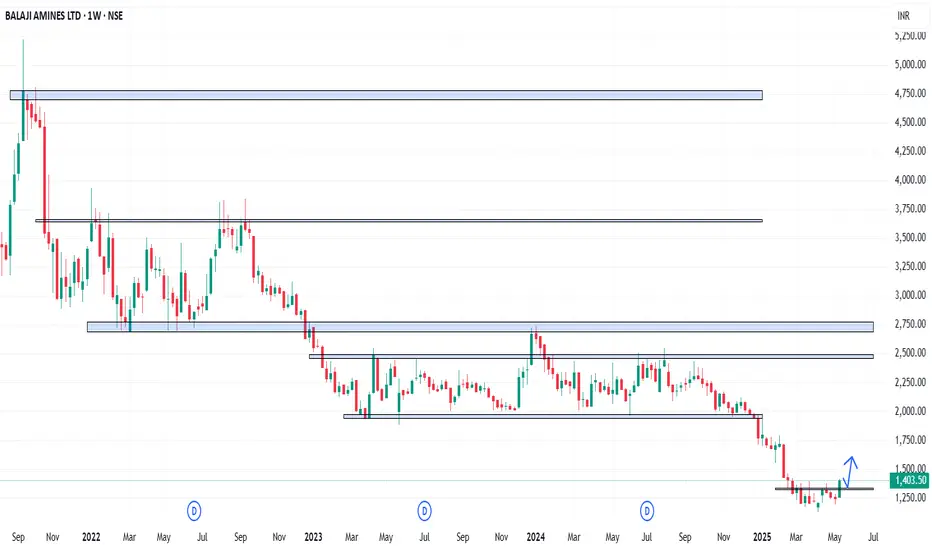
BALAMINES - Weekly AnalysisIn the Weekly Chart of BALAMINES ,
we can see that, it is at decision making point.
Possible momentums are shown in chart.
BALAMINES trade ideas

Balaji Amines LtdBalaji Amines is the stock which has created a very strong base and also if you can see in 1 hrs time frame volumes as squeezing and also this stock belong to chemical sector so we can see some strong momentum in this particular stock

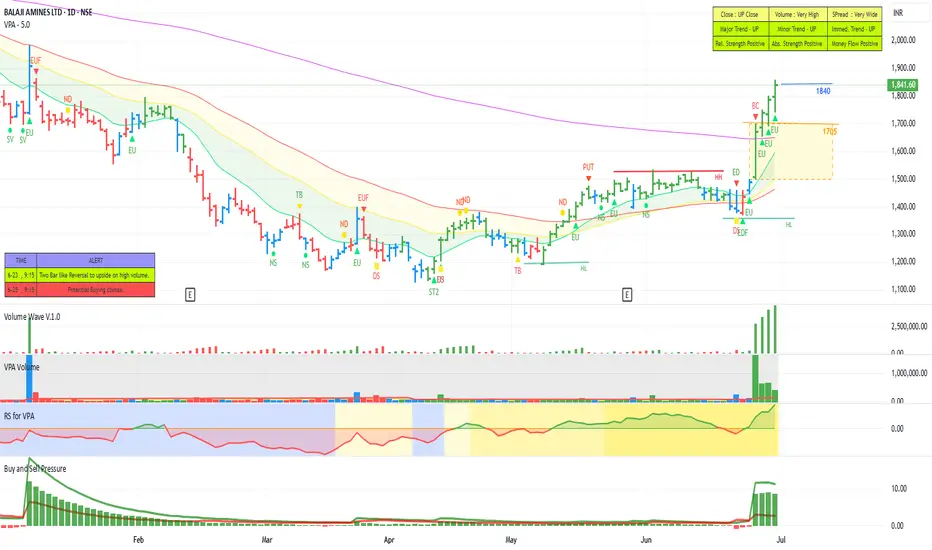
BALAJI AMINES - STEPPING INTO STAGE 2 ?The leading amine manufacturing company stocks had seen a huge down move of 50 to 60 percent. Of late many of these stocks have seen smart recovering. Leading stocks like alkyl amine, Vinati organics etc. crossed above the short-term moving averages. 200 DMA and moving up. Another stock in the group Balaji Amines has also started moving up now. After making a bottom it is now started making higher highs and Higher Lows. It also crossed above the short-term moving averages. The last few sessions we saw a huge momentum coming in with a huge Buy Wave pushing the stock above the 200 DMA. We can see that the relative strength and the absolute strength are also positive with the money also flowing into the stock. Now it is safely out above the 200 DMA with all other parameters looking positive. There is also good committed buying seen looking at the delivery volumes. The current momentum is likely to push up the stock further along in line with the other main amine manufacturing stocks.
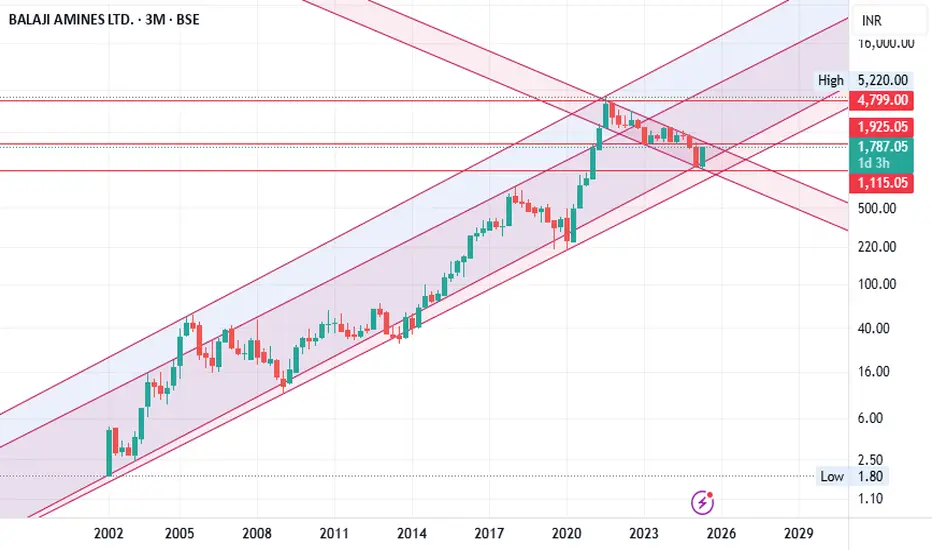
Balamines- History repeats itselfLong-Term Technical Analysis Summary
Trend: The price has been moving inside a strong upward-sloping parallel channel for over two decades.
Recent correction: After peaking in 2021, the stock corrected sharply and has now tested the lower boundary of the channel (support zone), bouncing from around ₹1142 to ₹1787 in the current candle. It took 4 years from Jul 2021 to Jan 2025 to reach the bottom from the top. Likewise it took 4 years from July 2005 to Jan 2009 to reach the bottom from the top.
Strong long-term support: Price respected the lower channel support and bounced, indicating bulls are still defending the structure.
🔍 Key Levels
Support Zone:
₹1,115: Major support near the lower channel and trendline confluence.
₹1,420: Previous low and another support level.
Resistance Zone:
₹1,925: Near-term resistance (currently being tested).
₹4,799: Major horizontal resistance.
₹5,220: All-time high and top of the rising channel.
Since price has already bounced strongly from ₹1,142 and broken above short-term downtrend resistance, current levels around ₹1,780–₹1,800 could still be considered an entry with confirmation.
🎯 Targets
Short-term: ₹1,925 (current resistance)
Medium-term: ₹2,800–₹3,200 (midline of the channel)
Long-term: ₹4,800 and ₹5,220+ (previous high and channel top)
🧠 Conclusion & Strategy
The stock is still firmly within a long-term bullish channel.
The recent bounce from channel support marks a potential reversal zone.
If momentum sustains and price breaks above ₹1,925, it confirms a trend continuation toward ₹3,000–₹5,200.
Accumulation at dips near the lower channel or retest zones is ideal for investors with a multi-quarter to multi-year view.
Note: This is for educational purpose only and not a stock recommendation.
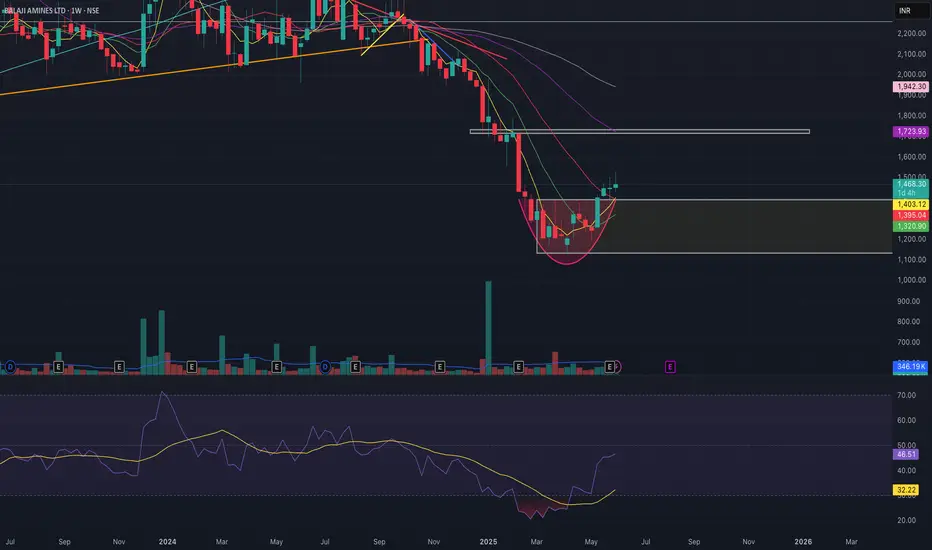
BALAJI AMINES all set to touch 1700CUP formation complete in W.
Good supports taken on MA
RSI divergence with strength.
Hoping to consolidate for few more day before the breakout.
SL:1390, TGT 1700,
BALAMINES - Weekly AnalysisIn the Weekly Chart of BALAMINES ,
we can see that; it has shown W shape recovery with a strong Bullish Candle.
Let it create one or two Halt candles to get more strong momentum.
Expected momentum is shown in chart.
Potential upmove | Bottom fishing - BALAMINESThese analysis is based on bottom fishing method. Meaning that the stock shows an uprising potential from the bottom. Fundamentally it can be due to any major decisions in the management or tremendous performance shown or any such positive actions. Technically, it would have shown an upmove using MA or RSI breakout or any such analysis.
IMPORTANT : Wait for weekly close above the breakout level.
The secret sauce is not revealed here that how I pick my stocks, however the idea is shared as an educational material. This will also help me to keep a track of my accuracy in doing analysis. Hence & also, I request anyone not to take any positions based on the accuracy of my previous feeds or moving forward.
Do your own research and analysis before investing your hard earned money.
Checkout an amazing breakout happened in the stock in Weekly timeframe, macroscopically seen in Daily timeframe. Having a great favour that the stock might be bullish expecting a staggering returns of minimum 25% TGT. IMPORTANT BREAKOUT LEVELS ARE ALWAYS RESPECTED!
NOTE for learners: Place the breakout levels as per the chart shared and track it yourself to get amazed!!
#No complicated chart patterns
#No big big indicators
#No Excel sheet or number magics
Time makes money, GREEDY & EGO will not make money.
Also, magically these breakouts tend to prove that the companies turn around and fundamentally becoming strong. Also the magic happens when more diversification is done in various sectors under various scripts with equal money invested in each N500 scripts.
The real deal is when to purchase and where to purchase the stock. That is where Breakout study comes into play.
LET'S PUMP IN SOME MONEY AND REVOLUTIONIZE THE NATION'S ECONOMY!
DISCLAIMER : This is just for educational purpose. This type of analysis is equivalent to catching a falling knife. If you are a warrior, you throw all the knives back else you will be sorrow if it hits SL. Make sure to do your analysis well. This type of analysis only suits high risks investor and whose is willing to throw all the knives above irrespective of any sectoral rotation. BE VERY CAUTIOUS AS IT IS EXTREME BOTTOM FISHING.
HOWEVER, THIS IS HOW MULTIBAGGERS ARE CAUGHT


Balaji Amines - Long Term Channel - Potential breakout ahead?Balaji Amines Ltd (NSE: BALAMINES) has been moving within a well-defined ascending channel on the monthly chart. The stock has shown consistent growth, respecting both the upper and lower boundaries of this channel.
The stock has been trading within this ascending channel for over a decade. Recently, it has tested the lower boundary and seems to be gearing up for another upward move.
Watch for a confirmed breakout above the trendline shown. The upward trajectory in the channel suggests that the long-term trend remains bullish, but caution is advised if the support at the bottom of the channel fails.
If the price breaks out above the upper trend line, it could signal the start of another impulse wave, potentially testing the upper boundary of the ascending channel.
Disclaimer: This analysis is for educational purposes and should not be considered financial advice.

Positional or Longterm Opportunity in Balaji AminesGo Long @ 2448.1 for Targets of 2686.05, 3160.5, and 3551 with SL 2284.45
Reasons to go Long :
1. On weekly timeframe stock gave Trendline breakout (marked with red color).
2. If we draw Fibonacci retracement from the recent swing low to the swing high then the stock took support from the 0.618 Fibonacci level.
3. In addition to this, the stock formed a Bullish Engulfing pattern around 0.618 Fibonacci level.

#BALAMINES - Reverse H&S in the mnakingBalaji Amines
Has been consolidating for quite some time and is range bound. Both time and price correction seems done.
CMP 2317
Target 3799 (64%)
⚡️Disclaimer: Any of my posts should not be considered as a Buy/Sell/Hold recommendation. This analysis is for educational and learning purpose only⚡️

BALAMINES - Weekly AnalysisIn the Weekly Chart of BALAMINES ,
we can see that; after consolidation near support, it has given breakout, but the breakout is not strong.
Let it create a Halt Candle and then enter with SL and Target.
Expected momentum is shown in chart.

Balamines analysis for long termBalamines is going through long trendline breakout.
levels marked on the chart.

Is BALAMINES Ready for weekly trendline Breakout?Hey Family, there is a one more stock Which is showing a great opportunity and forming Descending Triangle Pattern in daily TF it's trying to breakout resistance Trendline, If Stock break's resistance Trendline then we can see a good move, let's see breakout sustain or not.
Key Points
* It has posted good quarterly results.
* The stock has been consolidating for over a year.
* It is coming up to test it's weekly trendline. One can buy this on day close above 2435.
* Possible positional targets are 2400, 2700,3000 and trail.
What is your view please comment it down and also boost the idea this help to motivate us. We are Certified. All views shared on this channel are my personal opinion and is shared for educational purpose and should not be considered advise of any nature.

Watchout for weekly trendline BreakoutThe stock has been consolidating for over a year.
It has posted good quarterly results.
It is coming up to test it's weekly trendline. One can buy this on day close above 2435.
Possible positional targets are 2700, 3000 and 2400.
This is not a BUY/SELL recommendation.
This idea is for Educational Purpose only.
Learn & Earn,
Dr. Tanya Kumar

Balaji Amines - Turnaround story? Long above 2260 on the crossover of the 200EMA.
Add again above 2460 where it breaks into a new high which is also a trendline breakout of this entire downmove.
Stoploss for the first entry is 2180 and post the second entry is 2400.

Buy balamines for a target of 7200Buy balamines for a target of 7200 in one year
Stop loss - monthly close below 1880
Time frame- 12 months
Target of 2600 can be expected in 5-6 sessions
Stop loss- daily close below 2000

Balaji Amines formed big positive candle after Q4 ResultsWithing 15 mins, the stock formed a significant candle of 12%
Increased volatility around stock earnings is a common phenomenon in financial markets.
As companies release their quarterly or annual earnings reports, big investors eagerly anticipate the results, which can lead to heightened trading activity.
Positive earnings surprises may cause a surge in buying activity, driving up stock prices, while negative surprises can trigger selling pressure, leading to price declines.
Consequently, during earnings seasons, markets can experience sharp movements in stock prices therefore short term trading becomes Risky around imp events.

Balaji Amines formed BIg candle after Q4 Results Wihin 30 mins, the stock formed a significant candle of 12%
Increased volatility around stock earnings is a common phenomenon in financial markets.
As companies release their quarterly or annual earnings reports, BIg investors eagerly anticipate the results, which can lead to heightened trading activity.
Positive earnings surprises may cause a surge in buying activity, driving up stock prices, while Negative surprises can trigger selling pressure, leading to price declines.
Consequently, during earnings seasons, markets can experience sharp movements in stock prices therefore short term trading becomes Risky

Balaji Amines - Potential Double bottom PatternContra bet on Chemical Stocks, with Low Risk Setup - One can take small entry in at around 2500, while topping up once it touches 2670.
View invalid below - 2030 .
Disclaimer : Educational Content and not a recommendation

BALAJI AMINES - Bullish Consolidation with VolumesNSE: BALAMINES is closing with a bullish consolidation candle supported with volumes.
Today's volumes and candlestick formation indicates strong demand and stock should move to previous swing highs in the coming days.
The stock has been moving along the horizontal support for the past few days which is indicating demand.
One can look for a 13% to 20% gain on deployed capital in this swing trade.
The view is to be discarded in the event of the stock breaking previous swing low.
#NSEindia #Trading #StockMarketindia #Tradingview #SwingTrade

BALAMINES - Weekly AnalysisIn the Weekly Chart of BALAMINES ,
we can see that; it can give up move with W breakout.
If it gives W breakout, it will lead to Cup and Handle formation and breakout.
Trade with SL in this Volatile market.

BALAMINES - Weekly AnalysisIn the Weekly Chart of BALAMINES ,
we can see that; it has created a Decision making OR Halt candle.
Enter on breaking of high with Low as SL.
