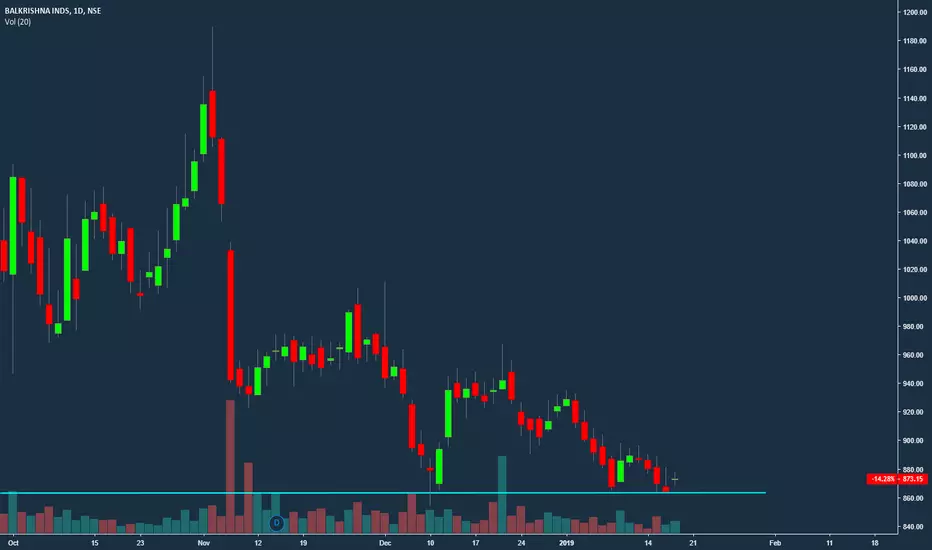
BalakrishnIndustries-WeakBalKrishIND - Looks weak if breaks 880.00 for short term target of 850-840..
CMP- 885.70
NSE:BALKRISIND
BALKRISIND trade ideas

BALKRISINDLEVELS ON CHART
B = BUY ABOVE
S = SELL BELOW
T = TARGET
BOOK 70% ON FIRST TARGET REST TRAIL


BALKRISIND, shoer weeklydo your own analysis and then trade.
don't forget to see what happened in next day and answer in comment if you like it,

Wait for Chaddi baniyan ( Bullish engulfing) Dont buy now or you will lose chaddi baniyan, buy only bullish engulfing , buy futures its going up , No worry buy only no selling


Long on Brake This trend seems ending its down move for a short term up side , You can look to buy on strong brake above the trend line and it will likely move to 1250+

Balkrishna Industries: Trade SetupBalkrishna Industries Trade Set Up
13th February 2019
Buy in the range 810 - 830
Stoploss: 790
Target: 880
Time Frame: 15 days
"Reverse TrendLine Breakout"


BALKRISIND Long TradeLong if it breaks the high of the previous day with a stop loss at the previous day's low.
In case of gap up above the previous day's high or gap down below the previous day's low, please avoid buying it or selling it respectively. Follow the ending of the candle formed in first 5 minutes and follow ORB strategy.


[Intraday] Insidebar BALKRISINDMade an inside bar , after falling for 4 days, made an inside bar , so it will have to go in some direction
Long if it breaks the high of the previous day with a stop loss at the previous day's low.
Short if it breaks the low of the previous day with a stop loss at the previous day's high.
In case of gap up above the previous day's high or gap down below the previous day's low, please avoid buying it or selling it respectively. Follow the ending of the candle formed in first 5 minutes and follow ORB strategy.
PDH - 877.7
PDL - 868.45
not the write time to enterTechnically it can slide 770 and if that level is broken, then, then it can slide further!

sell in Futures (a post for unknown friend ) This one i am posting for an Unknown friend , who is always wrong in the decisions , always take wrong decisions and put everything on fire , (Blocked me for telling the truth )
the Price is coming down and very clearly its in small corrective pattern which we call it as small flat , and price will start dropping and continue go down ,
what are important factors you can notice
01) Price is making lower low from very long period
02) price action is very narrow or negligible to consider any bullish sign
03) and its starts consolidating after 1 Hour , and usually they brake the 1 Hour candle high and then start moving in very narrow range body where retail traders think price will reverse and keep continue in holding position , until lastly he or she will be taken out if they have placed the stop loss orders
i dont say you should not trade these , i would say or request trade in the larger direction ,
04) Major point for understanding the Momentum , Many will talk about momentum indicator when its bullish , but no one has idea of when to sell or buy when trend is down ward (in bearish ) , always look for momentum indicator to come to 0 line on daily basis where the price close of daily candle should not be more than 1.1 % on open to close , which is clearly indicating the weak hand buying or price in range bond , once the brake of daily low you can look for going short and let the indicator make new low or nearest to previous low in order to cover your short , along the side of price action ( to Maintain trailing stop )
hope you Will understand some thing form this
Good Luck Happy New Year


