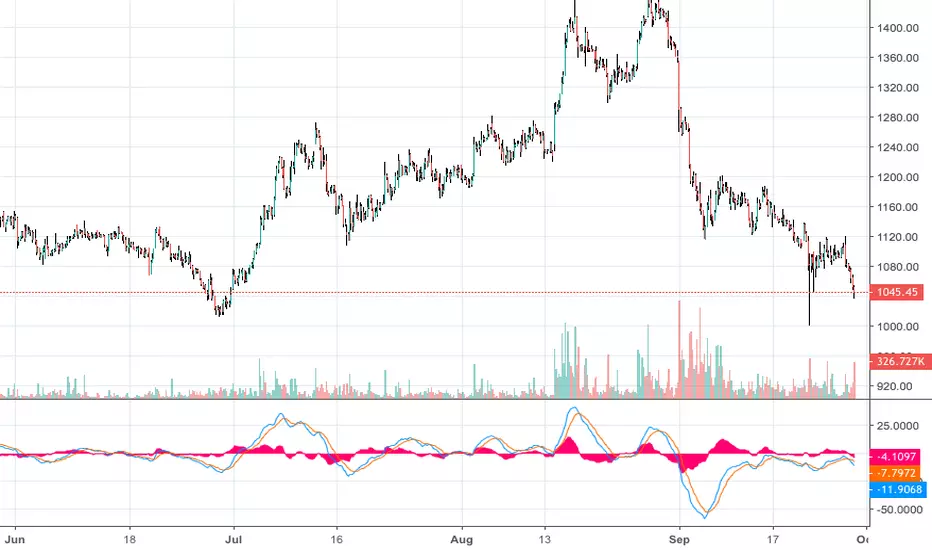
BALKRISIND | Multiple Bottoms but no sign yetBALKRISIND is trading at multiple bottoms, ie support levels but there is not sign of reversal yet. However one can carefully trade it. One can go long with SL below today's low.
BALKRISIND trade ideas


BalKrishna Inds - At supportSell below 1055 with the stop loss of 1070. Targets are 1040, 1020 and 1000.

#BALKRISHNA IND CASH : LOOKS GOOD ABOVE 1105#BALKRISHNA IND CASH
31 OCT 2018
LOOKS GOOD ABOVE 1105
STOPLOSS 1092
TARGET 1018-1020/1029-1030/1040
CMP 1095.2


BALKRISINDBALKTISIND support at 1000 and 973 if it breaks 1000 then it will see 950 and resistance at 1058 and 1096 if it breaks 1058 it should go upto 1100 further as per my view....


BalkrishnaInd October SeriesMonthly Chart
The uptrend has been broken on a monthly timeframe and it is likely to stay between 970 – 1200.
Weekly Chart
The stock is in a range and the 1015-1020 zone is acting as a support with the next immediate support as 975.
Daily Chart
The daily chart shows a minor resistance zone at 1135. The range 980 – 1000 definitely indicates a buying interest. However, owing to fundamentals impacting tyre stocks, PE could be a risky trade.
OI Analysis - The lower limit is 980 and the upper range is at 1200.
imgur.com
Payoff Graph - unofficed.com
Turtle Trade Idea
Sell 1150 CE at 16
Sell 1000 PE at 28.95


BALKRISINDmajor breakdown below 1005
short below 1005 for 1st target of 880
if closes above 1040 short will be invalid

BalKrishnaInd - At supportPrice is at the support zone 1000 - 1020. Awaiting for the trend direction.


Balkrishna Industries Long SetupLong if it breaks the high of the previous day with a stop loss at the previous day's low.
In case of gap up above the previous day's high or gap down below the previous day's low, please avoid buying it or selling it respectively. Follow the ending of the candle formed in first 5 minutes and follow ORB strategy.


Balkrishna Indu - ChannelDuring Year 2018, stock is nicely moving in upward channel. Every time its took
support near lower line (78.6%) of Channel & manage to bounce till 127.2% of previous down fall.
After that took resistance near 127.2% & falling till minumum 78.6% of upmove. As per previous chart dated 26.08.2018 though our trading SL hit but stock nicely respected its resistance level & fallen till support of channel (78.6%).
Stock is also at support of 200 EMA (Low).
This time again stock has taken support @ 78.6%, where channel support also comes.
If this time also support respected & manage to bounce then its risk reward looks favourable for long.
Other Details Mentioned In Chart.
Positional View For Educational Purpose Only.
Please Consult Your Financial Advisor Before Taking Any Decision.
I am not SEBI Registered Financial Advisor.ed Financial Advisor.
