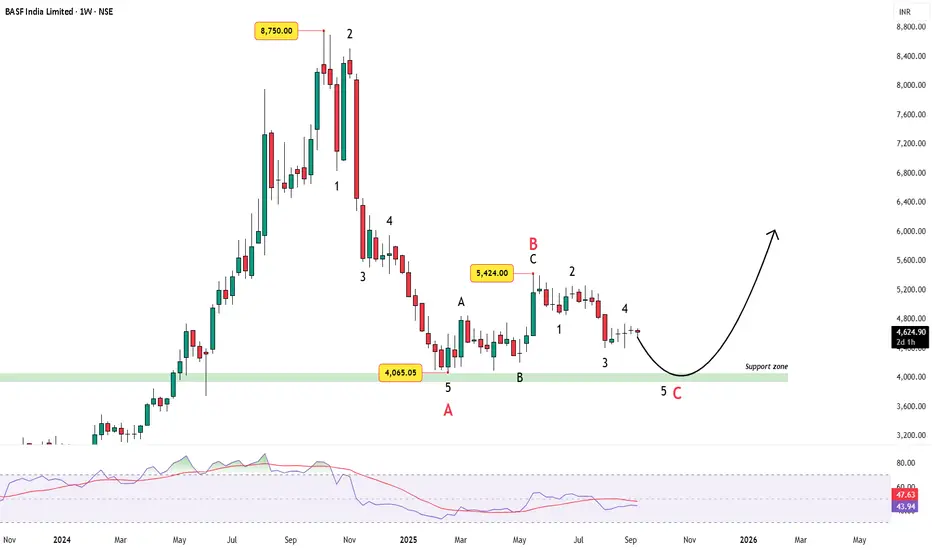
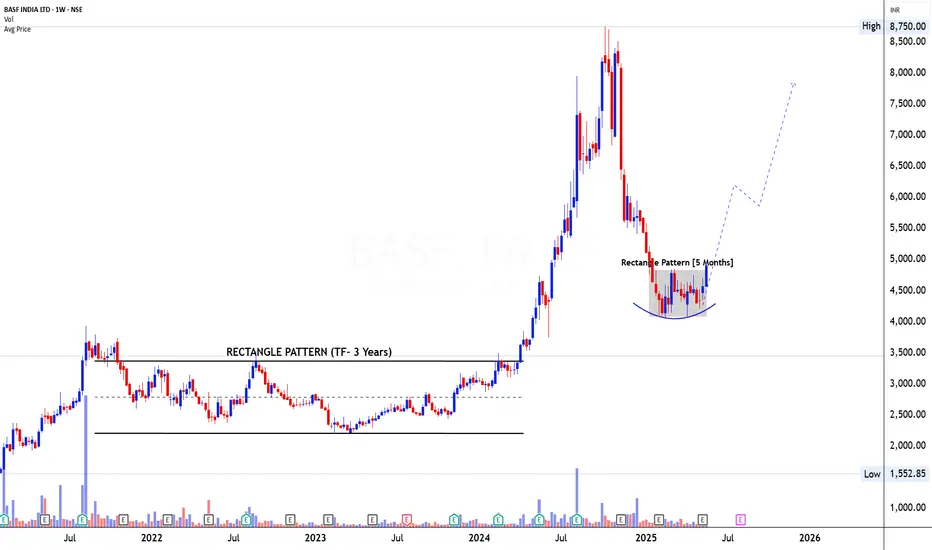
BASF India – 53% Correction Nearing Wave 5 SupportBASF India, a leading chemicals producer, has witnessed a sharp correction from its euphoric highs of ₹8,750. In just a few months, the stock retraced nearly 53%, wiping out more than half its gains.
Wave count
From the ATH, price unfolded into a 5-wave impulse decline, bottoming near ₹4,065. This completed the Wave A of the zigzag.
The subsequent recovery to ₹5,424 shaped up as a clear A-B-C corrective rally.
Since then, the stock has been carving out another 5-wave decline, now progressing towards its final leg (Wave 5 and eventually Wave C of the zigzag).
The support zone around ₹4,000 remains crucial — a likely area for Wave 5 to bottom.
Momentum Check
RSI sits near 43, showing weakness.
No strong bullish divergence yet, which hints at the possibility of one last dip before a reversal attempt.
Outlook
If Wave 5 completes around the ₹4,000 zone, this could complete the ABC zigzag and BASF India could set the stage for a larger rebound sequence into 2026. If price breaks below 4000 convincingly and continues the downtrend, then we are in for a further deep correction.
⚠️ Disclaimer: This analysis is for educational purposes only and does not constitute investment advice. Please do your own research (DYOR) before making any trading decisions.
Trade ideas
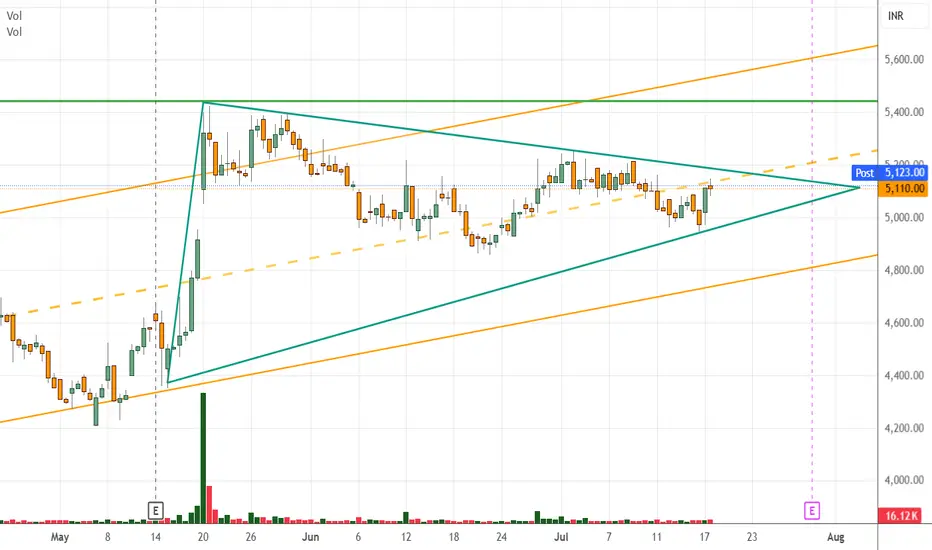
BASF - Weekly AnalysisIn the Weekly Chart of BASF ,
we can see that, it has consolidated near trendline.
Also, it is at decision making point.
Possible momentums are shown in chart.
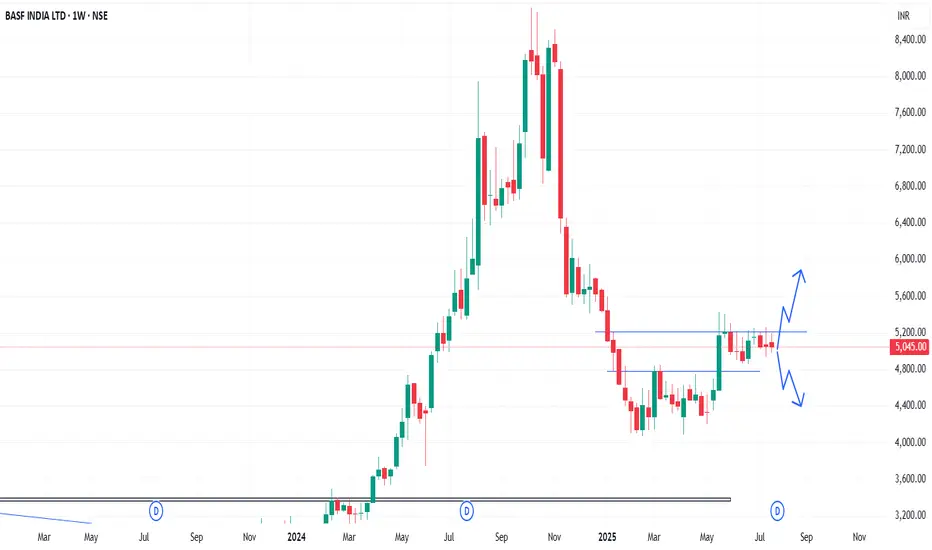
BASF India Ltd ₹ 5,115 3.11% 17 Jul 3:30 p.m.
If price breaks above Rs 5220 . in daily timeframe, then 1st Target is RS 5430 Stoploss your own.
DISCLAIMER:
I am not a SEBI-registered advisor. The content shared, including charts, ideas, and analysis, is purely for educational and informational purposes only. This should not be considered as financial or investment advice. Please do your own research or consult with a SEBI-registered professional before making any trading or investment decisions. I will not be responsible for any losses incurred.
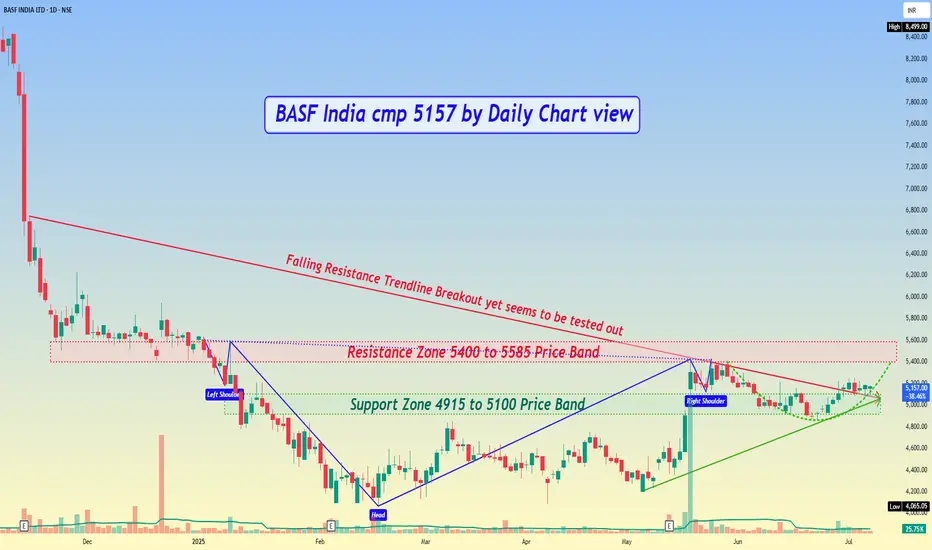
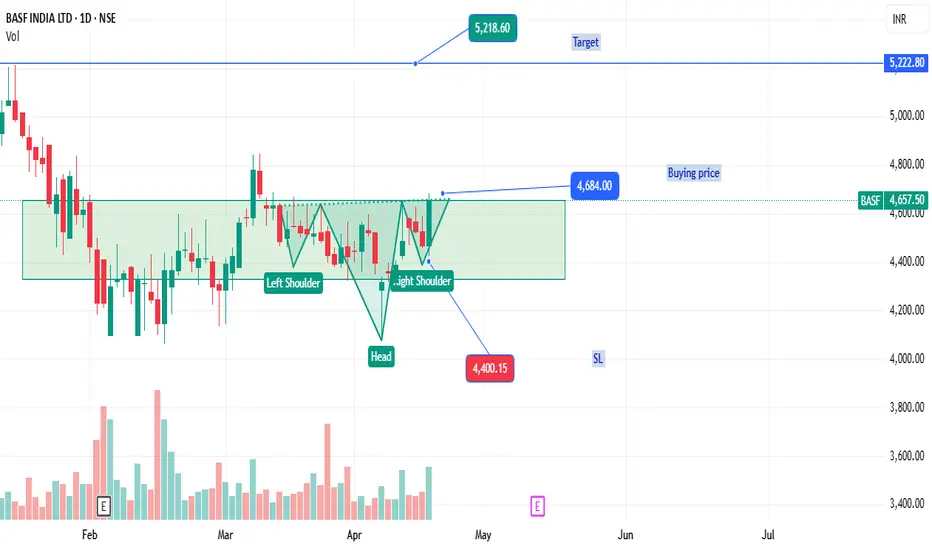
BASF India cmp 5157 by Daily Chart viewBASF India cmp 5157 by Daily Chart view
- Support Zone 4915 to 5100 Price Band
- Resistance Zone 5400 to 5585 Price Band
- Stock Price is in the process of Support Zone testing retesting
- Falling Resistance Trendline Breakout yet seems to be tested out
- Rising Support Trendline seems well respected and price well above it
- Bullish Head & Shoulder followed by a Rounding Bottom in completion stage
- Volumes seem to be on selling side, need to increase for fresh upside price movement
- Majority of the Technical Indicators seem to be turning positive for BB, EMA, MACD, RSI, SAR
BASF- Rectangle Pattern Breakout🚀 Breakout Stock Alert: BASF India Ltd (BASF)
📌 Price: ₹4,902.90 📊 Volume: 138.03K 📅 Date: 19-05-2025
① Pattern Name, Timeframe, Structure & Explanation
Daily Timeframe: Rectangle Base Pattern (5 Months)
Weekly Timeframe: Base Formation in Uptrend
On the daily chart, BASF has been coiling inside a rectangle consolidation pattern between ₹4,300–₹4,800 for nearly 5 months. The base is tight, with volatility compression and a subtle rounding shape at the lower support, hinting at accumulation. The recent breakout from this rectangle comes on the back of strong bullish action with increasing range and volume — indicating supply absorption and demand dominance.
On the weekly chart, this move gains even more significance. BASF had spent nearly 3 years (2021–2023) inside a broad rectangle, eventually giving a massive upside breakout in 2024. The recent pullback post-highs around ₹8,750 has now rounded out into a basing structure — potentially forming the right side of a new base, suggesting a continuation of the broader uptrend.
② Volume Formation (During Pattern, Breakout, and Retest)
Daily Timeframe: Volume remained muted within the rectangle, showing lack of interest during the base — a common trait in high-quality accumulation phases. The breakout candle on 19 May shows volume spike to 138K, far above the base average, confirming institutional buying interest.
Weekly Timeframe: Volume clearly dried up during the correction phase post-2024 top, and has now started building up again as price reclaims previous support-turned-base zones.
③ Breakout Candlestick, Follow-Through & Trap Behavior
Breakout Candle (Daily): A wide-range, full-bodied bullish candle with gap-up characteristics and a +7.2% move, backed by a sharp volume surge — textbook breakout behavior
Follow-Through Watch: The stock may now retest the breakout zone of ₹4,750–₹4,800. A low-volume pullback would offer a healthy re-entry.
Trap Behavior: No signs of fakeouts or premature breakdowns. The rectangle was tight and clean — this breakout appears genuine and well-structured.
④ Trade Explanation (Entry, Target, Stop-loss, Risk\:Reward)
Entry Zone: ₹4,880–₹4,950 (near breakout close or minor dip)
Stop-loss: ₹4,600 (below rectangle low and base support)
*Target Zone: ₹6,200 (initial), ₹7,200–₹7,500 (long-term structure)
📏 Measured Move (Rectangle Range):
Range = ₹4,800 - ₹4,300 = ₹500
Target = ₹4,800 + ₹500 = ₹5,300 (short-term)
But considering weekly rounding base, extended moves toward ₹6,200+ are probable.
Risk\:Reward Analysis:
Risk = ₹350
Reward = ₹1,200–₹2,300
R\:R = \~1:3.4 to 1:6.5
#Trading #Investing #Stocks #TechnicalAnalysis
Swing Trade BASF
📍 LTP: ₹3902
Entry, Stop Loss (SL), and Targets are clearly mentioned in the chart.
There are 2 separate trade options provided —
Please follow them exactly as shared and do not mix them up.
🔹 If you choose Trade Option 1 (Buy on Dips) → Follow its specific SL
🔹 If you choose Trade Option 2 → Follow the SL mentioned for that setup
📌 Clarity in execution is key to proper risk management.
Plz follow TSL in order to maximize your profits
Lets hope it'll move as per our expectations
If you like this idea 💡 --- Plz don't miss to Boost 🚀
For more info - Plz visit my profile & Follow me
Rgds,
Naresh G
SEBI Reg.RA

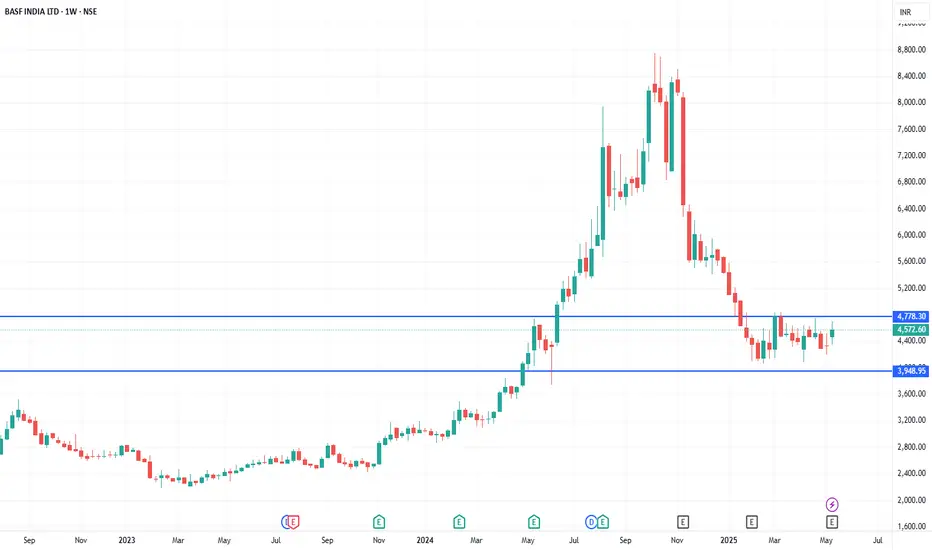
BASF is getting ready to give good return .once it cross 4780 on weekly basis it will give good return
SYMBOL : BASF
CONDITION CLOSE ABOVE 4780 ON WEEKLY
TARGET : 5630
SL: 4040 ON WEEKLY CLOSING BASIS
DISC: THIS IS NOT BUY/SELL RECCOMENDATION.ITS ONLY FOR EDUCATIOL PURPOSE.
BASF: LONGNSE:BASF
Formed base support, Hammer on 7 Apr 2025 and Bullish candle on 21 Apr 2025, the last bullish candle of 21 Apr has engulf the previous 3 candle with increase in volume, if you look closely, it has also formed Inverted H&S pattern.
All levels are marked on chart
BASFNote:
1. Views are personal and for educational purposes only. Recheck and take the trade as per your RR.
2. Always remember SL is your lifeline, not the big target...
3. Follow us for more patterns and like, share so that we feel it is helpful to many and share more patterns...
3. Views given here is not a tip rather it is for educational purpose... Aftermarket opens, the condition might change so learn to handle different conditions...
Keep an eye ladies and gentlemen. Cheers and Happy Trading


BASF on a strong supportBASF is consolidating near a strong support. We can see a higher low, higher formation with daily RSI over 60 which indicates that a breakout might happen soon.
Stock might face resistance at 2650 and 2800 levels.
Kindly trade as per your own analysis since this idea is shared only for educational purpose.

BASF, cmp 30271. Watch for breakout.
2. Retest of previous resistance/resistance turned support
3. Multiple attempts on trendline.
4. 5300 Target

BASF India - Cup & Handle Pattern BASF is making cup and handle pattern. We can expect price to move towards 4500+. Other factors:
1. MACD is becoming positive
2. RSI is above 60, showing bullish sign
3. Volume is steady
"Clean Charts, Easy Charts"
Learning & Earning!!!
Cheers!!

BUY TODAY SELL TOMORROW for 5%DON’T HAVE TIME TO MANAGE YOUR TRADES?
- Take BTST trades at 3:25 pm every day
- Try to exit by taking 4-7% profit of each trade
- SL can also be maintained as closing below the low of the breakout candle
Now, why do I prefer BTST over swing trades? The primary reason is that I have observed that 90% of the stocks give most of the movement in just 1-2 days and the rest of the time they either consolidate or fall.
Trendline Breakout in BASF
BUY TODAY SELL TOMORROW for 5%

BASF | Positional Trade📊 DETAILS
Sector: Pesticides & Agrochemicals
Mkt Cap: 13,999 cr
BASF India Ltd's portfolio consists of six segments: Agricultural Solutions, Materials, Industrial solutions, Surface Technologies, Nutrition & Care and Chemicals.
TTM PE : 39.44 (High PE)
Sector PE : 17.32
Beta : 0.58
📚 INSIGHTS
MC Insights PRO
Stock with medium financial performance with average price momentum and valuation. These stocks may be affordable and are showing some investors interest.
4.09% away from 52 week high
Outperformer - BASF India up by 7.4% v/s NIFTY 50 down by -0.43% in last 1 month
📈 FINANCIALS
Piotroski Score of 5/9 indicates Average Financials
Disclaimer: This analysis is for educational purposes only, and I'm not a SEBI registered analyst.
If you found this analysis helpful, I encourage you to like and share it. Your observations and comments are also welcomed below. Your support, likes, follows, and comments motivate me to consistently share valuable insights with you.
🔍 More Analysis & Trade Setups 🔍
For more technical analysis and trade setups, make sure to follow me on TradingView: www.tradingview.com

BASF INDIA ANALYSISFOR LEARNING PURPOSE
BASF INDIA - The current price of BASF INDIA is 4062.5 rupees
I am going to buy this stock because of the reasons as follows-
1. Its coming out from a good consolidation base
2. The breakout candle is good with great volume
3. Its giving 3 year high break after some rest and making ATH
4. It is showing better relative strength as it stood strong in volatile times
5. The risk and reward is favourable
6. This stock has underperformed in last few years but now, its showing some signs that it can do good and now probably it can act as leader for next few weeks
I am going to buy this on Monday with minimum target of 35-40% and then will trail after that.
My SL is at 3520 rupees
I will be managing my risk.

Cup pattern breakout Cup pattern breakout on weekly chart. Followed with ascending channel pattern breakout.

Breakout StocksBest Stock For Short Term Investment or Swing Trade
Breaking All time high with Decent Delivery Volumes
It May Retest Somewhat around 3800 and then give a decent rally upto 35%
Disclaimer - Educational Purpose only we are not liable for any consequences

6 months viewBullish on chemical sector. one of the top performing stock. rounding bottom pattern.
40% upside possible in coming months.

BASF - Weekly AnalysisIn the Weekly Chart of BASF ,
we can see that, it has shown a strong bullish momentum.
It might retest the 3500 levels to take a halt.
Expected momentums are shown in chart.

BASF HEAD&SHOULDER BREAKOUTH&S breakout confirmed and coming down for correction look for buy at lows,this stock has 30% target from CMP

BASF India--C&H PatternSymbol:BASF India
Chart Pattern:Cup and Handle
Time Frame: Daily
Disclosure:
Chart display only for educational purpose.
No buy or sell reco.
i am not sebi reg Research Analyst.

BASF - Weekly AnalysisIn the Weekly Chart of BASF ,
we can see that, it has made a breakout of 2 weeks consolidation .
It has respected the resistance.
it can spend some more time at resistance then go for a higher targets.
