Bharti Airtel is in a good buying zoneStock is in good buying zone .any 1 can entre in cmp sl would be below 1626 . Frst target would be 1686 and if it sustain dat price den we can see 1724.
BHARTIARTL trade ideas

Bharti Airtel LimitedBharti Airtel Limited traded at a day low of ₹1218 on June 3, 2024, and from there, it reached an all-time high of ₹1770 on September 26, 2014. The AVWAP from June 3, 2024, has acted as strong support and has held multiple times

Airtel Strong Q3 and Uptrend NSE:BHARTIARTL is showing a good uptrend with good Q3 Numbers.
Revenue growth was driven by strong underlying momentum in India, sustained constant currency growth in Africa, and the consolidation of Indus Tower Limited, effective 19 November 2024. Net profit increased significantly due to an exceptional net fair value gain on Indus Tower and a forex gain due to currency appreciation. Capex for FY25 is expected to be lower than FY24, and that would expand in FY26. Fibre rollout continues to be a key area of focus for the company.
About:
NSE:BHARTIARTL is one of the world’s leading providers of telecommunication services. It is in 18 countries, including India, Sri Lanka, and 14 African countries.
F&O Activity:
Long Buildup in Futures with 1720 CE Gaining Significant OI.
Trade Setup:
It looks like a good 1:1 trade setup, with the recent base as a strong support zone, the RSI and MACD trending upwards, and the trendline being respected.
Target(Take Profit):
Around 1720 Levels for Swing & 1842 for Positional Trader.
Stop Loss:
Entry Candle Low or Trendline for Swing Trader and Recent Base for Positional Trader.
📌Thank you for exploring my idea! I hope you found it valuable.
🙏FLLOW for more
👍BOOST if useful
✍️COMMENT Below your views.
Meanwhile, check out my other stock ideas below until this trade is activated. I would love your feedback.
Disclaimer: "I am not SEBI REGISTERED RESEARCH ANALYST AND INVESTMENT ADVISER."
This analysis is intended solely for informational and educational purposes only and should not be interpreted as financial advice. It is advisable to consult a qualified financial advisor or conduct thorough research before making investment decisions.

Airtel Bearish View For Next 3 Months**Bharti Airtel Limited** (commonly known as **Airtel**) is one of India’s largest and most prominent telecommunications companies. It provides mobile services, broadband, digital TV, and enterprise solutions across multiple countries.
### **Key Facts About Airtel:**
- **Founded:** 1995
- **Founder:** Sunil Bharti Mittal
- **Headquarters:** New Delhi, India
- **Chairman:** Sunil Bharti Mittal
- **CEO (India & South Asia):** Gopal Vittal
- **Revenue:** Over **₹1.3 lakh crore** (varies yearly)
- **Stock Listing:** Traded on **NSE & BSE** (Airtel’s stock ticker: **BHARTIARTL**)
### **Major Business Segments:**
1. **Mobile Services** – Offers 4G, 5G, and voice services across **India, Africa, and South Asia**.
2. **Airtel Xstream Fiber** – High-speed broadband and fiber internet services.
3. **Airtel DTH (Direct-to-Home)** – Digital TV services through **Airtel Digital TV**.
4. **Airtel Business** – Provides telecom and cloud solutions for enterprises.
5. **Airtel Payments Bank** – A digital banking service offering UPI, wallets, and savings accounts.
6. **Airtel IoT & Cloud** – Enterprise solutions including cloud computing and IoT (Internet of Things).
7. **Airtel Wynk & Xstream** – Digital content services for music, movies, and OTT streaming.
### **Global Presence:**
Airtel operates in **over 18 countries**, including **India, Africa (under Airtel Africa), and Sri Lanka**. It is one of the largest telecom providers in the world.
### **Competitors:**
- **Reliance Jio** (biggest competitor in India)
- **Vodafone Idea (Vi)**
- **BSNL/MTNL**
- **International rivals** (MTN, Orange, etc. in Africa)
Are you looking for specific information like stock performance, latest news, or business strategies?

Bharti Airtel - Positional trade ideaAirtel is consolidating when broader market is falling making it a high relative strength share. I would wait for a breakout from the consolidation with good volumes. This trade might last for a year or so after entering, typically more of a positional trade.
Take advise from your financial advisor before taking any position, this material is just for a reference purpose.

Bharti Airtel – Strong Setup for Short-Term & Positional HoldingHello everyone! Hope you're all doing great in life and in trading. Today, I bring you a stock that has not only given a strong breakout but also delivered exceptional Q3 FY25 results stock name is Bharti Airtel Ltd. and it is the world’s leading providers of telecommunication services with presence in 18 countries representing India, SriLanka, 14 countries in Africa.
After breaking out of a descending trendline , Bharti Airtel is now retesting the 1630-1600 support zone . If this level holds, we could see a strong upside move in the coming sessions. The technical structure remains bullish, with an entry zone between 1630-1600 , and targets at 1688, 1736, and 1778 , while the final positional target is set at 1955 . For risk management, a short-term stop loss at 1570 and a positional stop loss at 1520 should be considered. RSI is showing strong momentum , and volume confirmation on the breakout strengthens the bullish case
.
Latest Q3 FY25 results highlight consistent revenue and profit growth . The company’s standalone revenue surged 19.1 percent YoY to 45,129 crore , with its India business growing 24.6 percent YoY . ARPU has increased to 245 , boosting overall profitability. EBITDA came in at 24,880 crore , with a 55.1 percent margin , showing strong operational efficiency. On the expansion front, 5G rollout is progressing aggressively, with 5.2K new towers added , and the subscriber base has grown by 25.2 million users . Additionally, Bharti Airtel has significantly improved its financial position, having prepaid 36,263 crore in spectrum dues , further strengthening its balance sheet.
Market Cap
₹ 9,70,118 Cr.
Current Price
₹ 1,620
High / Low
₹ 1,779 / 1,098
Stock P/E
48.5
Book Value
₹ 153
Dividend Yield
0.49 %
ROCE
13.1 %
ROE
14.9 %
Face Value
₹ 5.00
Industry PE
40.9
Debt
₹ 2,25,541 Cr.
EPS
₹ 43.2
Promoter holding
53.1 %
Intrinsic Value
₹ 421
Return over 5years
25.1 %
Debt to equity
2.59
Net profit
₹ 27,074 Cr.
Disclaimer:- This analysis is for educational purposes only. Please trade responsibly and consult a financial advisor before making any decisions.
If you found this analysis helpful, don’t forget to like, follow, and share your thoughts in the comments below! Your support keeps me motivated to share more insights. Let’s grow and learn together—happy trading!

Bharti Airtel Cmp 1717 dated 14-2-2025Bharti Airtel Cmp 1717 dated 14-2-2025
1. Ascending Triangle BO @ 1685
2. Price rise with Volumes
3. RSI BO
Buy above 1725 SL 1680 target 17401750-1760-1770-1780
Pattern target 1860 SL 1585

What is option chain pcr ?The Put-Call Ratio (PCR) is a popular technical indicator used by investors to assess market sentiment. It is calculated by dividing the volume or open interest of put options by call options over a specific time period. A higher PCR suggests bearish sentiment, while a lower PCR indicates bullish sentiment.
The Put Call Ratio (PCR) is a popular metric traders use to gauge market sentiment. It is calculated by dividing the number of put options by the number of call options. A high PCR indicates a bearish sentiment, as more traders buy puts, expecting the market to decline
An options chain displays all available option contracts for a security, organized by expiration date and strike price. Options chains typically show each contract's bid price, ask price, volume, open interest, and implied volatility.

What should we expect from wave 4 (Hold)/ For investors1. Wave 4 will happen after the end of wave 3 , its obvious .
2. wave 4 will alternate with wave 2 . Thats law of the markets .
3. If wave 3 is 261.8% (normal) /423.6% (Extended) of wave 1 taken from the end of wave 2 . Then
(a) - A target has been achieved , we need to sell first and see later.
(b) We need to look for price / time consolidation depending upon the structure of wave 2 to observe wave 4 for alteration.
In this case wave 3 if 423.6% (on regular scale) and wave 4 is happening (which should give time consolidation only) . But we should never predict markets . Its a hold . Investors should not expect any aggressive price appreciation or depreciation . Best for call selling if in portfolio .Regards

Bharti Airtel-Will it breakout and sustain?📊 Bharti Airtel Chart Analysis –
Bharti Airtel is trading in an upward channel but recently fell out of it and started forming a base. The stock is at a critical juncture, currently near its 50 DMA, with volume building up. This suggests the potential for a breakout or breakdown, depending on broader market conditions and price action.
🎯 Trading Plan:
📌 EarlyEntry Zone: ₹1,710.50 (small quantities recommended initially).
📌 Stop Loss (SL): ₹1,501.90 (closing basis) – ~12.2% below the entry.
📌 Prtial booking/Fresh Entry: ₹1,777.30 (~3.9% gain from entry).
📌 Positional Target): ₹2,104.40 (~23% gain from entry).
📌 Risk-to-Reward (R:R): 1:1.8 (approx.).
✨ Why This Setup?
📈 Trend Potential: Stock is trading above key DMAs (50, 200) despite the broader bearish market, highlighting its relative strength.
🏛️ Volume Support: Gradual volume accumulation near the 50 DMA indicates potential institutional interest.
📉 Downside Risks: The stock is against the overall bearish trend, increasing the chances of breakout failures in these market conditions.
🛡️ Risk Management: Entering in small quantities reduces risk, especially when the broader market is trending Lower High, Lower Low (LH LL).
⚠️ Risks to Consider:
Market Trend: The broader market remains bearish, with weak sentiment and no structural change yet.
Breakout Failure: Many breakouts in current conditions tend to retrace 10-20% brutally, shaking out weak hands.
💡 Tips for Trading This Setup:
Partial Profits: Once the entry is triggered, consider booking partial profits along the way.
Trailing SL: Use a trailing stop loss to lock in gains if the stock starts moving in your favor.
Position Sizing: Keep position sizes small to manage risks effectively.
Wait for Confirmation: Safe players should wait for the broader market to stabilize above 50 and 200 DMA and structure to shift to Higher High, Higher Low (HH HL).
📝 Educational Takeaway:
Stocks like Bharti Airtel, which are among the least affected in a bearish market, can outperform once the market stabilizes. However, in current conditions, the probability of breakout failures is high, so it’s essential to follow risk management and avoid aggressive positions.
🚀 Stay Disciplined and Trade Smart!
📢 Disclaimer:
This analysis is for educational purposes only and does not constitute financial or investment advice. Please conduct your own research and consult a certified financial advisor before making any trading decisions. Trading and investing involve risks, and past performance is not indicative of future results.

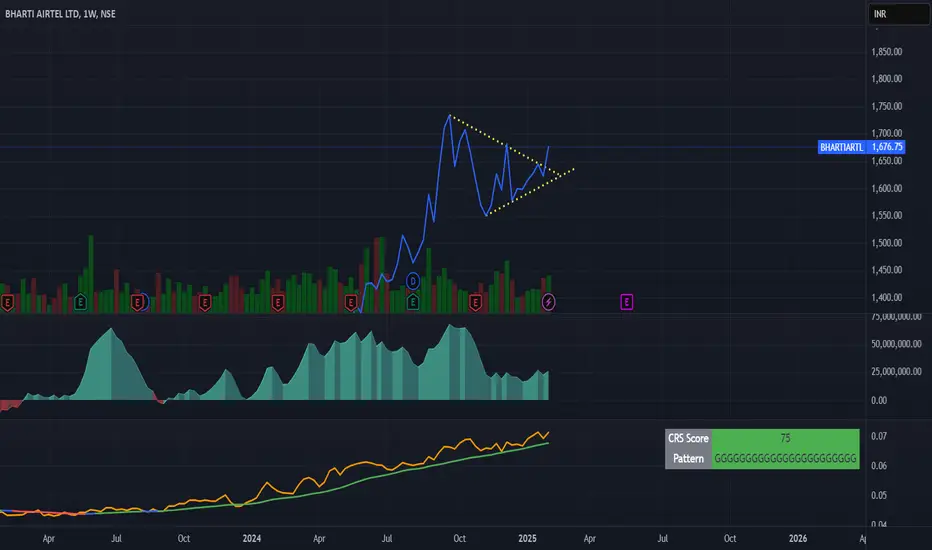
BHARTI AIRTEL - SYMMETRICAL TRINGLE BREAKOUT### **Symmetrical Triangle Breakout Analysis – Bharti Airtel Ltd (Weekly Chart)**
#### **1️⃣ Pattern Overview**
- A **Symmetrical Triangle** has formed after a strong **uptrend**, indicating a potential continuation.
- The price is **compressing within converging trendlines**, suggesting a breakout is near.
#### **2️⃣ Breakout Confirmation**
✅ **Bullish Scenario:**
- A **break and close above ₹1,700** with strong volume confirms an upside breakout.
- The breakout target is the **height of the triangle added to the breakout level** (estimated around **₹1,850 - ₹1,900**).
- RSI and **CRS Score of 75** indicate relative strength in the stock.
❌ **Bearish Scenario:**
- A **break below ₹1,600** with volume suggests a downside move.
- The price may test **₹1,450 - ₹1,400** if the breakdown is confirmed.
#### **3️⃣ Key Indicators to Watch**
📊 **Volume:** A spike in volume will confirm a strong breakout.
📉 **RSI & Momentum:** If RSI stays above 50, the bullish momentum remains intact.
🟢 **CRS Score (75):** Indicates stock is outperforming the market.
#### **4️⃣ Trade Plan**
📌 **Entry:** Buy above ₹1,700 after breakout confirmation.
📌 **Stop Loss:** Below ₹1,600 (previous support).
📌 **Target:** ₹1,850 - ₹1,900 for a bullish breakout.
🚀 **Final View:** **Stock is in a strong uptrend, and a breakout above ₹1,700 could trigger a big move. Keep an eye on volume and confirmation candle!**
Bharti Airtel cmp 1676.75 by Daily Chart viewBharti Airtel cmp 1676.75 by Daily Chart view
- Support Zone at 1610 to 1625 Price Band
- Resistance Zone at 1685 to 1700 Price Band
- Price shouldering on Rising Support Trendline and well above Falling Resistance Trendline
- Daily basis Support seen at 1625 > 1574 > 1521 with the Resistance seen at 1717 > ATH 1779
- Bullish Rounding Bottoms made with Support Zone incorporated within them indicative of good breakout probability

Classic VCP pattern.Bharti Airtel has been ranging since last couple of months forming a VCP pattern. Today finally it breakout due to its robust result which announced yesterday. Considering a good volume breakout, i have entered at 1650.

Bharti Airtel's Resilience Amid Market VolatilityBharti Airtel stays resilient in a volatile market, driven by exceptional profit growth.
Key points:
1. Company reported a stellar 461% QoQ profit growth for Q3, boosted by a one-time consolidation from Indus Towers.
2. Price has found heavy support at the 38.2% retracement level and faces strong resistance at the 23.6% level.
3. The stock may climb to 1778 to fill the gap and form a double top, creating a shorting opportunity.

VIEW ON BHARTI AIRTELCURRENT PRICE: 1619
RESISTANCE:1660-1680
SUPPORT:1570-1600
if it fails to cross above resistance, we will see more downside moves. Target would be 1570-1525-1501

Bharti Airtel looks good to buy Bharti Airtel bounced from the support and likely to give breakout on monday,
will recommend to buy if remain positive on next trading session.
target : 1700-1750-1800
SL below : 1570

Bharti Airtel Symmetrical Triangle Pattern Breakout Wait for Breakout
This post is for educational purpose for Swing/Positional Trading

Airtel Bharti Technical showing Bullish trendline.Bharti airtel is showing some amazing charts for bullish trendlines and breakouts. It can reach to 25% upside.

A perfect flag pattern form in Bharti Airtel Chart watch out.Bharti Airtel may participation strongly in next bull run. Put this stock into your watchlist.

Airtel : BreakoutFor Educational purpose only
Above 1655 there will be start of an uptrend.
all are mentioned on chart itself
Put Stoploss on closing basis.
(In Trading Time it may go above/below stoploss But closing price is most important).
These are levels are generated on the basis on Fibonacci Series
NOTE : I am not SEBI registered advisor in capital market.
Disclaimer:- Please always do your own analysis or consult with your financial advisor before taking any kind of trades. Please understand Risk in trading before taking any trade with your financial consult. I am only sharing my knowledge it may be right or sometimes wrong so I am not liable for any loss.
Dear traders, If you like my work then do not forget to hit like and follow me, and guy's let me know what do you think about this idea in comment box, i would be love to reply all of you guy's.
Thank you.

#BHARTIARTL - Potential Trend Line Break Out📊 Script: BHARTIARTL
Key highlights: 💡⚡
📈 VCP formation in Daily chart.
📈 Price gave a good up move, then went Side Ways
📈 wait for more consolidation near Resistance / Trend Line
📈 Enter on BO when spike in Volume is seen
📈 MACD Bounce
📈 One can go for Swing Trade.
BUY ONLY ABOVE NA DCB
⏱️ C.M.P 📑💰- 1644
🟢 Target 🎯🏆 – NA%
⚠️ Stoploss ☠️🚫 – NA%
⚠️ Important: Always Exit the trade before any Event.
⚠️ Important: Always maintain your Risk & Reward Ratio.
✅Boost, Like and follow to never miss a new idea! ✅
Disclaimer: I am not SEBI Registered Advisor. My posts are purely for training and educational purposes.
Eat🍜 Sleep😴 TradingView📈 Repeat 🔁
Happy learning with MMT. Cheers!🥂

Possible trendline breakoutBharti Airtel,
A possible resistance trendline and pattern breakout trade.
Breakout close above 1680.

view on AIRTELBharti Airtel looks bullish ahead of budget. Will it be able to break this disjoint channel would be interesting to watch. If it cross 1640 can do 1710-1750
Below 1625 view goes invalid !!
no buy/sell recommendation. :)
