Price Action Trading Price action trading is a strategy where traders make decisions based on the price movements of an asset, rather than relying on technical indicators or other external factors. It involves analyzing historical price patterns and movements to identify potential trading opportunities and predict future price direction.
BHARTIARTL trade ideas

Database Trading"Database trading" refers to using structured databases, often containing financial market data, to make trading decisions. This involves analyzing historical data, identifying patterns, and potentially automating trading strategies based on those findings. It can also encompass the idea of trading access to data itself on a platform similar to a stock exchange.

Bharti AirtelBharti Airtel's 15-minute chart presents an interesting setup for a potential short position. I will refrain from taking any long positions on this stock. Even if a stop-loss is triggered, it would be acceptable given the favorable risk-reward ratio. If a trade goes in your favor, it is advisable to secure profits. Consider initiating a short position below ₹1810, and set a stop-loss based on the chart's indications.

BHARTIAITEL-SHORT FOR 15 %Best perforrming stock in Nfty 50 since 2023
technicals are showing fatigue and momentum reversal
negative diveregence is observed in mothly ,weekly & daily charts
sequence of events are mared
SL and target and SL marked

BHARTI AIRTEL LTD As of May 15, 2025, Bharti Airtel Ltd. (NSE: BHARTIARTL) is trading at ₹1,834.20. The stock has experienced significant growth over the past year, with a 12-month return of approximately 42.8%.
📅 Monthly Closing Prices (May 2024 – May 2025)
Month Closing Price (₹)
May 2025 1,837.90
April 2025 1,864.50
March 2025 1,733.40
February 2025 1,570.20
January 2025 1,626.30
December 2024 1,587.75
November 2024 1,627.15
October 2024 1,612.60
September 2024 1,709.55
August 2024 1,589.05
July 2024 1,483.28
June 2024 1,436.05
May 2024 1,365.14
📈 Key Price Highlights
52-Week High: ₹1,917.00 (May 7, 2025)
52-Week Low: ₹1,219.05
All-Time High: ₹1,917.00
All-Time Low: ₹9.31
📊 Performance Summary
1-Month Return: +4.4%
3-Month Return: +6.8%
1-Year Return: +42.8%
3-Year Return: +165.8%
5-Year Return: +239.8%
🔍 Analyst Insights
Average Analyst Target: ₹1,900 – ₹2,350
Consensus: Majority of analysts maintain a "Buy" rating.
Bharti Airtel Ltd // 2hour Support and ResistanceAs of May 3, 2025, here are the key 2-hour support and resistance levels for Bharti Airtel Ltd (NSE: BHARTIARTL):
📊 2-Hour Support and Resistance Levels
Level Price (₹) Type
Support 1 1,590.27
Support 2 1,561.57
Support 3 1,549.38
Resistance 1 1,618.97
Resistance 2 1,606.78
Resistance 3 1,635.48
These levels are derived from the classic pivot point method and are crucial for traders to monitor, as movements beyond these points may indicate potential changes in the stock's trend.
🔍 Technical Indicators
As of the latest available data:
Relative Strength Index (RSI): 39.84, indicating neutral momentum.
Stochastic RSI: 11.36, suggesting potential for upward movement.
Commodity Channel Index (CCI): -155.75, reflecting bearish momentum.
Money Flow Index (MFI): 62.2, indicating an uptrend.
These indicators suggest a neutral to slightly bullish outlook for the stock.
📈 Strategy Considerations
Bullish Scenario: If the stock price maintains above the support levels, particularly Support 1 at ₹1,590.27, it may continue its upward movement towards Resistance 1 at ₹1,618.97.
Bearish Scenario: A drop below Support 1 could signal a potential reversal or consolidation phase.
Please note that these levels are based on historical data and should be used in conjunction with other technical analysis tools and market conditions.

BHARTI AIRTEL (GOOD RR)Here you clearly see the trendline breakout & made a high of 1687
And currently price taking pullback & It may took support near trendline.
So we may take long positions from here.
Targets are 1700, 1772, 1825, 1885
View got invalid if any weekly candle closes below 1568
.
I am not a SEBI Registered. This analysis is purely for educational purposes only.
.
If you gain some learning from this chart, then please like this post for more reach & also do comment if you have any questions regarding this.

Bharti Airtel strong Breakout and New All time High"Why Bharti Airtel Stands Strong in India’s Ever-Changing Telecom Industry"
Bharti Airtel Limited is one of India’s largest and most trusted telecommunications companies. It operates in 18 countries across Asia and Africa, providing a wide range of services including
Telecommunication Services Sector
The telecom sector is the backbone of digital infrastructure, enabling mobile connectivity, internet, and data services for individuals, businesses, and governments.
Key Growth Drivers for Sector & Stock :
Rising internet and smartphone penetration
5G network rollouts
Digital transformation across industries
Increasing demand for cloud & enterprise connectivity
Growth in OTT, online gaming, and IoT devices
Why Bharti Airtel Stands Out
Strong market share in both mobile and broadband segments
Focused on premium customer base with higher ARPU
Aggressively expanding 5G coverage and fiber network
Consistent debt reduction and strong cash flows
Fast-growing enterprise business and digital services
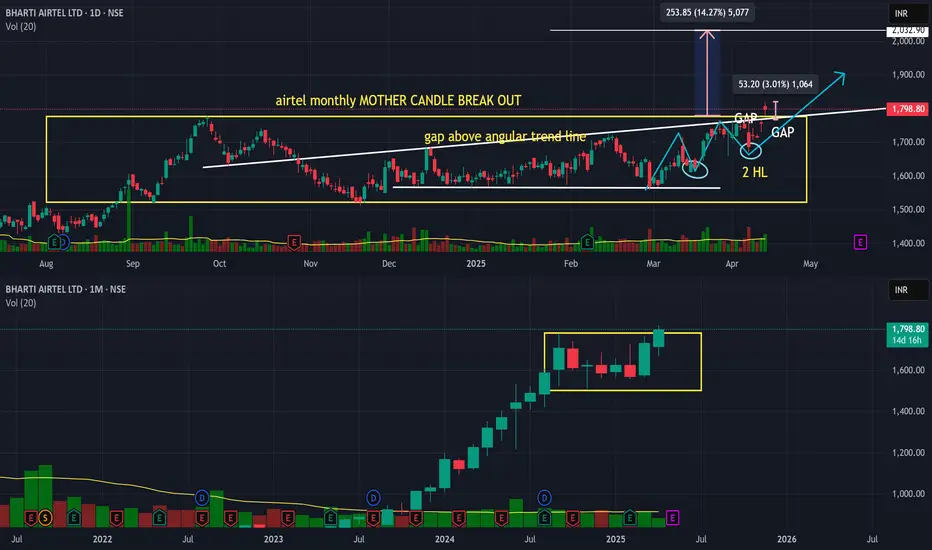
airtel mother candle breakout with a new target airtel after 6 six month of sideways, break the monthly candle, as per the Elliott wave this could be the 3rd impulsive wave, breakout of mother candle and angular trend line with the gap-up rsi macd and stoch is up tick in weekly monthly and daily, airtel has a new target of 2032
Bharti Airtel Swing TradeBharti Airtel has grabbed monthly liquidity and is ready to make ATH if overall market holds current level ie Nifty holds 22000.

### Bharti Airtel Price Analysis (April 11, 2025)### Bharti Airtel Price Analysis (April 11, 2025)
#### **Current Price and Recent Trends**
- **Latest Price:** ₹1,715.55 (as of April 9, 2025).
- **Intraday Movement (April 9, 2025):**
- **Open:** ₹1,719.65
- **High:** ₹1,726.85
- **Low:** ₹1,711.60
- **Average Price:** ₹1,717.90
- **Previous Close:** ₹1,720.40 (-0.29% change).
#### **Performance Metrics**
- **Short-Term Trends:**
- Last 3 months: Price increased by **6.17%**.
- **Long-Term Trends:**
- Last 12 months: Price grew by **39.54%**.
- Over the last 3 years: Stock delivered a return of **125.11%**, outperforming the BSE Telecommunications index (+37.96%).
#### **Fundamental Insights**
- **Market Cap:** ₹9,80,990 crore.
- **P/E Ratio:** 50.50 (high compared to industry standards).
- **ROCE (Return on Capital Employed):** 11.55%.
- **Revenue Growth:** QoQ revenue growth of **9.28%**, highest in three years.
- **ARPU Growth:** Driven by premiumization and higher tariff plans post-July 2024 hikes.
#### **Technical Analysis**
- The stock is currently moving sideways based on recent intraday trends.
- Resistance levels could be around ₹1,726–₹1,730, while support levels are near ₹1,710.
#### **Sector Outlook**
- Analysts expect moderate growth in Q4FY25 for telecom companies due to stabilizing tariff hike impacts and fewer days in the quarter.
- Airtel is projected to see an increase in India revenue by **8.7% QoQ** and EBITDA growth of **0.1% QoQ**.
#### **Strengths**
1. Strong long-term returns outperforming peers and sector indices.
2. Revenue growth driven by ARPU increases and premiumization.
3. Stable user additions (~3–4 million expected in Q4FY25).
#### **Weaknesses**
1. High P/E ratio suggests overvaluation compared to peers.
2. Sideways price movement indicates limited short-term momentum.
### Conclusion:
Bharti Airtel remains a strong performer with robust long-term growth potential driven by tariff hikes and premiumization strategies. However, its high valuation may limit upside in the short term. Investors should monitor Q4FY25 results for further insights into revenue and subscriber trends.

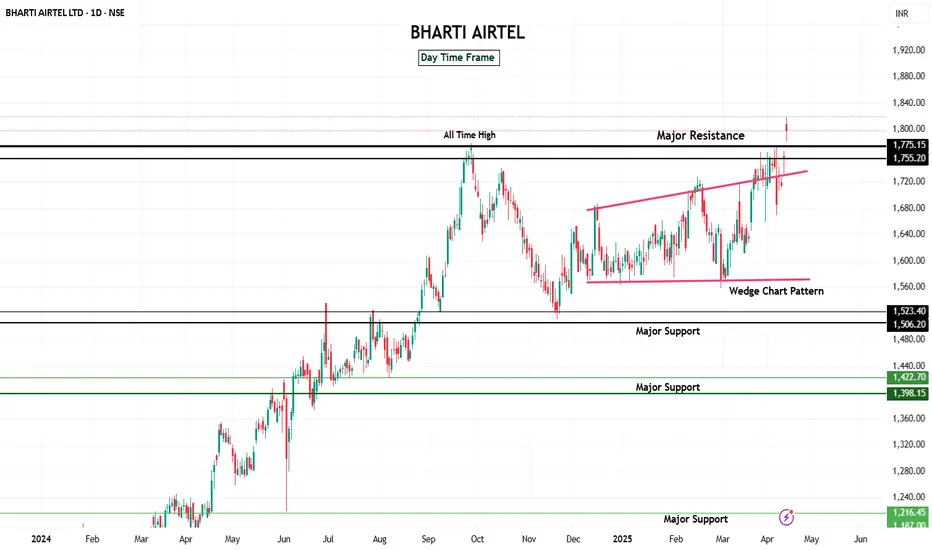
Bharti Airtel ltd: Testing All-Time Highs Amid Strong FinancialsTechnical Analysis:
Bharti Airtel has shown a strong bullish structure ever since its listing. Starting from around ₹600 in 2020, the stock steadily climbed to ₹1,700+ levels by September 2024.
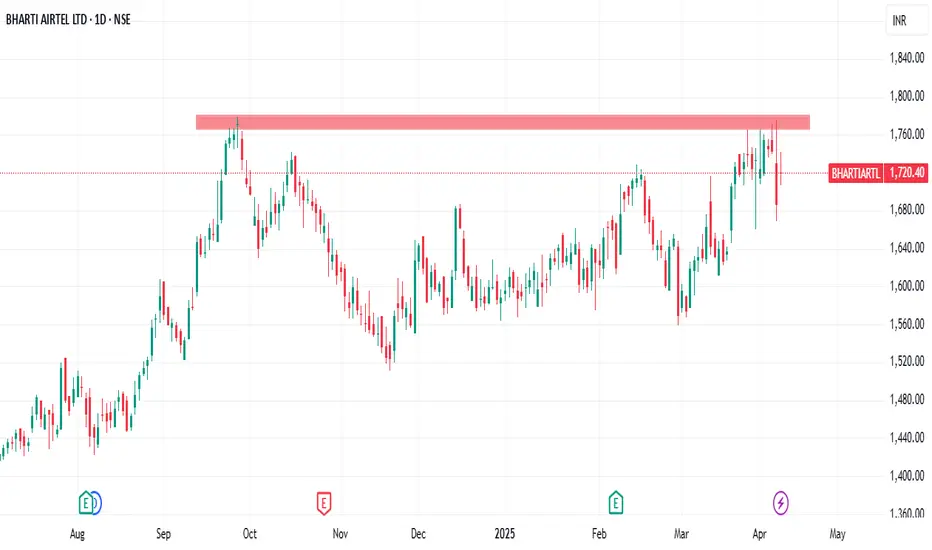
Since then, it’s been consolidating, facing a strong resistance zone between ₹1,720 and ₹1,780, which is currently acting as the all-time high zone.
Post Q3 results announcement on 6th February 2025, the stock jumped over 5%, reflecting the market’s positive response. It is again testing this resistance zone.
If this ₹1,780 level is breached and holds, we can expect further upside with targets at ₹1,800, ₹1,860, and ₹1,920.
On the downside, ₹1,510–₹1,565 remains a critical support zone. Breach below this could lead to deeper correction.
Fundamental Analysis:
Despite the market resistance, the company has posted exceptionally strong Q3 FY24 results, which support its bullish narrative:
📌 Q3 FY24 Key Financial Highlights (Compared to Previous Quarters):
Total Income: ₹45,129 Cr (vs ₹41,473 Cr in Q2 FY24 and ₹37,900 Cr in Q3 FY23)
Total Expenses: ₹20,533 Cr (vs ₹19,627 Cr in Q2 FY24 and ₹18,085 Cr in Q3 FY23)
Total Operating Profit: ₹24,596 Cr (vs ₹21,846 Cr in Q2 FY24 and ₹19,815 Cr in Q3 FY23)
Profit Before Tax: ₹16,892 Cr (vs ₹5,897 Cr in Q2 FY24 and ₹4,108 Cr in Q3 FY23)
Profit After Tax: ₹16,135 Cr (vs ₹4,153 Cr in Q2 FY24 and ₹2,876 Cr in Q3 FY23)
Diluted Normalized EPS: ₹25.95 (vs ₹6.31 in Q2 FY24 and ₹4.34 in Q3 FY23)
📈 Key Drivers Behind the Rally:
ARPU Growth: Average Revenue Per User improved to ₹245 in Q3 FY24.
Strong Data Usage: Mobile data consumption rose 23.2% YoY.
Home Services Growth: Over 6.7 lakh new home broadband users added in Q3.
Business Expansion: Focus on 5G rollout and enterprise connectivity is fueling long-term growth.
Conclusion:
Bharti Airtel is at a decisive level technically and fundamentally. A breakout above ₹1,780 backed by candlestick confirmation may lead to a new bullish leg.
💡 Target Levels: ₹1,800 – ₹1,860 – ₹1,920
🛑 Support Zone: ₹1,510 – ₹1,565
Keep these key levels on radar for the upcoming sessions.
🔔 Disclaimer: This report is for educational purposes only. Always consult your financial advisor before making any investment decisions.

Bharti Airtel ltd: Testing All-Time Highs Amid Strong FinancialsTechnical Analysis:
Bharti Airtel has shown a strong bullish structure ever since its listing. Starting from around ₹600 in 2020, the stock steadily climbed to ₹1,700+ levels by September 2024.
Since then, it’s been consolidating, facing a strong resistance zone between ₹1,720 and ₹1,780, which is currently acting as the all-time high zone.
Post Q3 results announcement on 6th February 2025, the stock jumped over 5%, reflecting the market’s positive response. It is again testing this resistance zone.
If this ₹1,780 level is breached and holds, we can expect further upside with targets at ₹1,800, ₹1,860, and ₹1,920.
On the downside, ₹1,510–₹1,565 remains a critical support zone. Breach below this could lead to deeper correction.
Fundamental Analysis:
Despite the market resistance, the company has posted exceptionally strong Q3 FY24 results, which support its bullish narrative:
📌 Q3 FY24 Key Financial Highlights (Compared to Previous Quarters):
Total Income: ₹45,129 Cr (vs ₹41,473 Cr in Q2 FY24 and ₹37,900 Cr in Q3 FY23)
Total Expenses: ₹20,533 Cr (vs ₹19,627 Cr in Q2 FY24 and ₹18,085 Cr in Q3 FY23)
Total Operating Profit: ₹24,596 Cr (vs ₹21,846 Cr in Q2 FY24 and ₹19,815 Cr in Q3 FY23)
Profit Before Tax: ₹16,892 Cr (vs ₹5,897 Cr in Q2 FY24 and ₹4,108 Cr in Q3 FY23)
Profit After Tax: ₹16,135 Cr (vs ₹4,153 Cr in Q2 FY24 and ₹2,876 Cr in Q3 FY23)
Diluted Normalized EPS: ₹25.95 (vs ₹6.31 in Q2 FY24 and ₹4.34 in Q3 FY23)
📈 Key Drivers Behind the Rally:
ARPU Growth: Average Revenue Per User improved to ₹245 in Q3 FY24.
Strong Data Usage: Mobile data consumption rose 23.2% YoY.
Home Services Growth: Over 6.7 lakh new home broadband users added in Q3.
Business Expansion: Focus on 5G rollout and enterprise connectivity is fueling long-term growth.
Conclusion:
Bharti Airtel is at a decisive level technically and fundamentally. A breakout above ₹1,780 backed by candlestick confirmation may lead to a new bullish leg.
💡 Target Levels: ₹1,800 – ₹1,860 – ₹1,920
🛑 Support Zone: ₹1,510 – ₹1,565
Keep these key levels on radar for the upcoming sessions.
🔔 Disclaimer: This report is for educational purposes only. Always consult your financial advisor before making any investment decisions.
Amazing breakout on WEEKLY Timeframe -BHARTIARTLCheckout an amazing breakout happened in the stock in Weekly timeframe, macroscopically seen in Daily timeframe. Having a great favor that the stock might be bullish expecting a staggering returns of minimum 25% TGT. IMPORTANT BREAKOUT LEVELS ARE ALWAYS RESPECTED!
NOTE for learners: Place the breakout levels as per the chart shared and track it yourself to get amazed!!
#No complicated chart patterns
#No big big indicators
#No Excel sheet or number magics
TRADE IDEA: WAIT FOR THE STOCK TO BREAKOUT IN WEEKLY TIMEFRAME ABOVE THIS LEVEL.
Checkout an amazing breakout happened in the stock in Weekly timeframe.
Breakouts happening in longer timeframe is way more powerful than the breakouts seen in Daily timeframe. You can blindly invest once the weekly candle closes above the breakout line and stay invested forever. Also these stocks breakouts are lifelong predictions, it means technically these breakouts happen giving more returns in the longer runs. Hence, even when the scrip makes a loss of 10% / 20% / 30% / 50%, the stock will regain and turn around. Once they again enter the same breakout level, they will flyyyyyyyyyyyy like a ROCKET if held in the portfolio in the longer run.
Time makes money, GREEDY & EGO will not make money.
Also, magically these breakouts tend to prove that the companies turn around and fundamentally becoming strong. Also the magic happens when more diversification is done in various sectors under various scripts with equal money invested in each N500 scripts.
The real deal is when to purchase and where to purchase the stock. That is where Breakout study comes into play.
LET'S PUMP IN SOME MONEY AND REVOLUTIONIZE THE NATION'S ECONOMY!
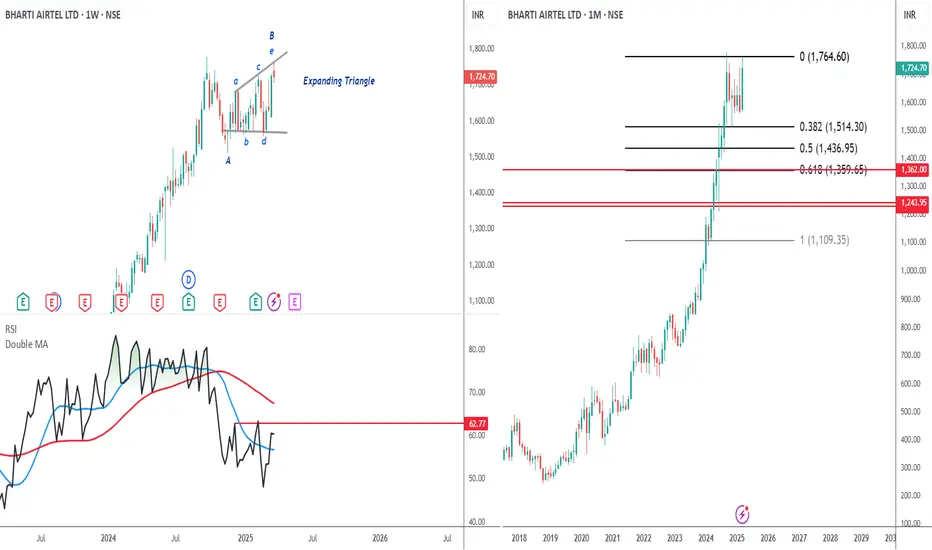
Another heavy weight about to correctBharti Airtel CMP 1724
Elliott- the stock has formed an expanding triangle in its B wave which is a rally in a three wave correction ABC. The C wave will have 5 waves and will be a fast fall.
Fibs- In my view the Fib confluence at 1360 is the minimum correction that this stock will witness. This is a good 20% from the current levels.
RSI - the stock is on the highs where as the oscillator cannot go past the bear zone of 60-65 is negative.
Conclusion - With a weight of 4.25%, Bharti has the 5th highest weightage in Nifty. Hence yet another heavy weight showing it is about to give a deep correction.
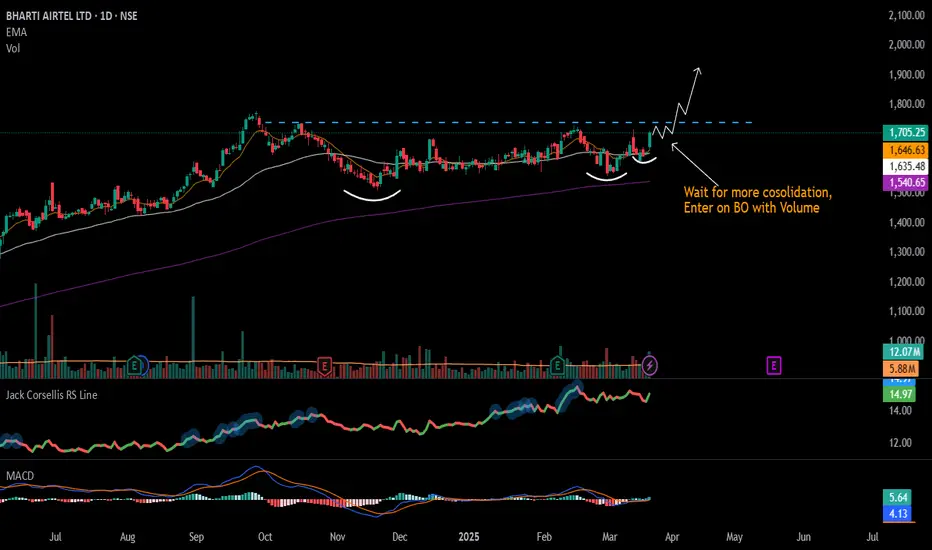
#BHARTIARTL - Potential Breakout Stock / Keep in WL 📊 Script: BHARTIARTL
Key highlights: 💡⚡
📈 VCP formation in Daily chart.
📈 Wait for consolidation
📈 Enter Breakout on Volume spike
📈 MACD Bounce
📈 RS is bullish
📈 One can go for Swing Trade.
BUY ONLY ABOVE 1772 DCB
⏱️ C.M.P 📑💰- 1705
🟢 Target 🎯🏆 – NA%
⚠️ Stoploss ☠️🚫 – NA%
️⚠️ Important: Market conditions are getting better, Position size 50% per Trade. Protect Capital Always
⚠️ Important: Always Exit the trade before any Event.
⚠️ Important: Always maintain your Risk:Reward Ratio as 1:2, with this RR, you only need a 33% win rate to Breakeven.
✅Like and follow to never miss a new idea!✅
Disclaimer: I am not SEBI Registered Advisor. My posts are purely for training and educational purposes.
Eat🍜 Sleep😴 TradingView📈 Repeat 🔁
Happy learning with MMT. Cheers!🥂
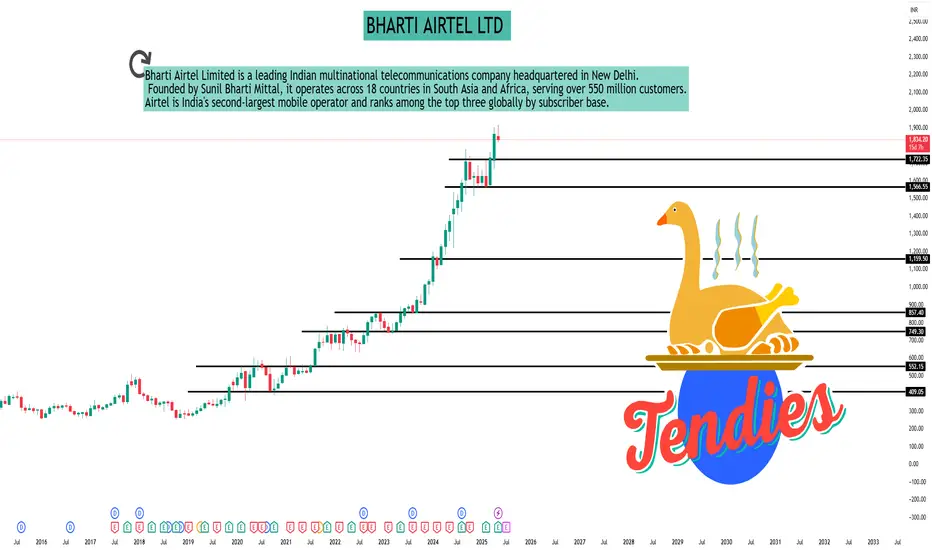
bharti Airtel Bearish View Bharti Airtel Is Very Expensive **Bharti Airtel** is one of the largest telecommunications companies in the world, headquartered in **New Delhi, India**. It provides a wide range of services, including **mobile services**, **broadband**, **digital TV**, and **enterprise solutions**. Airtel operates in **18 countries** across **Asia** and **Africa** and is a market leader in India's telecom sector.
---
## **Key Facts**
- **Founded:** 1995 (as Bharti Tele-Ventures Limited)
- **Founder:** Sunil Bharti Mittal
- **Headquarters:** New Delhi, India
- **Chairman:** Sunil Bharti Mittal
- **CEO:** Gopal Vittal
- **Employees:** Over 40,000
- **Revenue:** Over ₹140,000 crore (FY 2023)
- **Stock Listings:**
- NSE: BHARTIARTL
- BSE: 532454
---
## **Services and Offerings**
### 📱 **Mobile Services**
- One of the largest mobile service providers globally
- **4G** and **5G** services across India and key global markets
- Prepaid and postpaid plans with high-speed data and voice calling
---
### 🌐 **Broadband and Internet**
- **Airtel Xstream Fiber** – High-speed fiber broadband
- Plans up to **1 Gbps** with OTT app bundles
---
### 📺 **Digital TV**
- **Airtel DTH** – Direct-to-home satellite TV service
- Over **500+ channels** with HD and 4K support
---
### 🏢 **Enterprise Solutions**
- **Airtel Business** – Solutions for large and small businesses
- Cloud services
- Data centers
- Internet of Things (IoT)
- Cybersecurity solutions
---
### 💳 **Payments and Financial Services**
- **Airtel Payments Bank** – India's first payments bank
- Offers digital banking, UPI payments, and savings accounts
---
### 🎧 **Digital Platforms**
- **Wynk Music** – Music streaming app
- **Airtel Xstream** – Video streaming platform
- **Airtel Thanks App** – Rewards and customer management app
---
## **Global Presence**
Airtel operates in:
🌍 **India** (largest market)
🌍 **South Asia** (Sri Lanka, Bangladesh)
🌍 **Africa** (14 countries, including Nigeria, Kenya, and Uganda)
---
## **Achievements and Recognition**
✅ India's **second-largest mobile operator** (after Jio)
✅ Among the **top three telecom operators** globally by subscriber base
✅ First to launch **VoLTE** (Voice over LTE) in India
✅ Strong focus on **5G rollout** and **network expansion**
---
## **Key Competitors**
- **Reliance Jio** – Leading Indian telecom rival
- **Vodafone Idea** – Competing in mobile and broadband services
- **MTN Group** – Rival in African markets
---

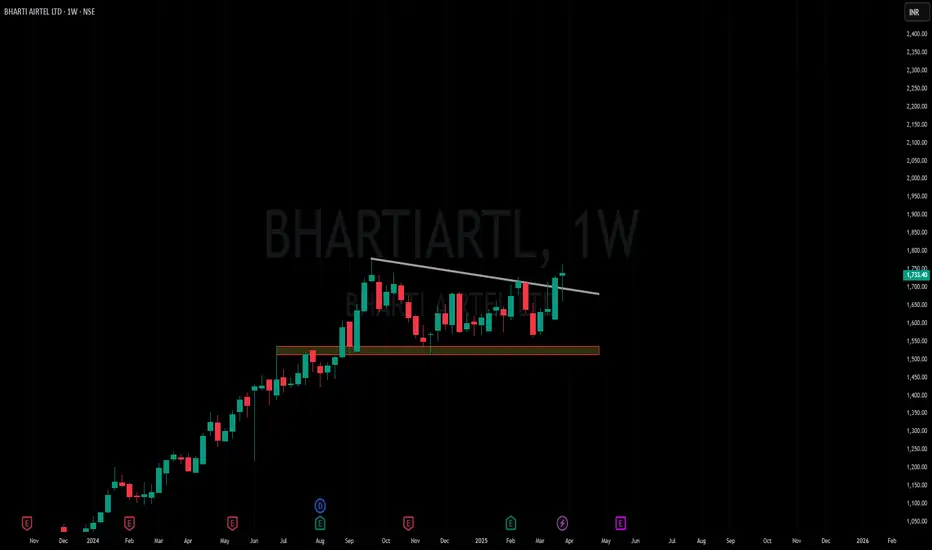
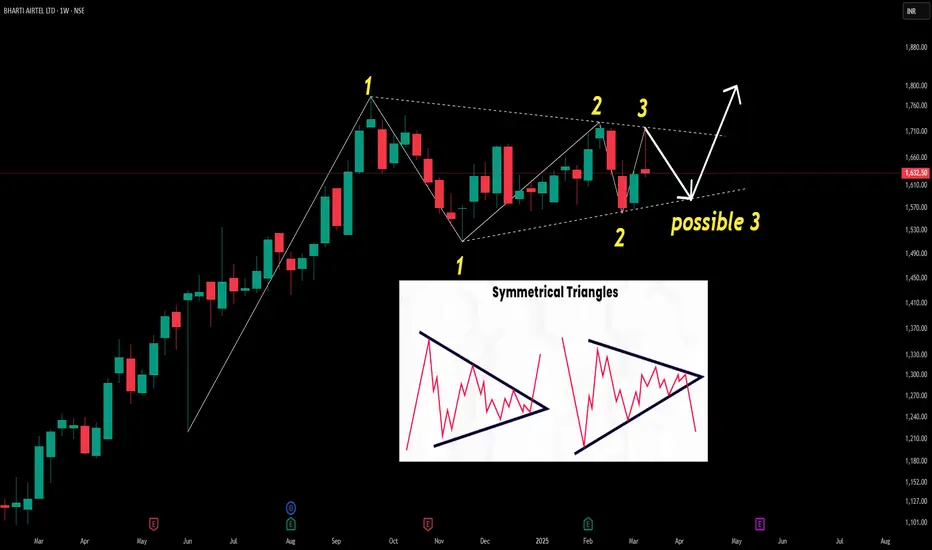
Symmetrical Triangle Pattern Identified: BHARTI AIRTEL LTDThis weekly candlestick chart highlights a symmetrical triangle pattern, a classic signal of potential breakout opportunities. With key points marked (1, 2, 3), traders can analyze possible breakout directions for informed decisions.
harti Airtel Ltd., incorporated in the year 1995, is a Large Cap company (having a market cap of Rs 9,93,885.70 Crore) operating in Telecommunications sector.
Bharti Airtel Ltd. key Products/Revenue Segments include Service Revenue and Sale of Products for the year ending 31-Mar-2024.
For the quarter ended 31-12-2024, the company has reported a Consolidated Total Income of Rs 45,599.00 Crore, up 9.28 % from last quarter Total Income of Rs 41,728.00 Crore and up 18.94 % from last year same quarter Total Income of Rs 38,339.30 Crore. Company has reported net profit after tax of Rs 14,474.90 Crore in latest quarter.
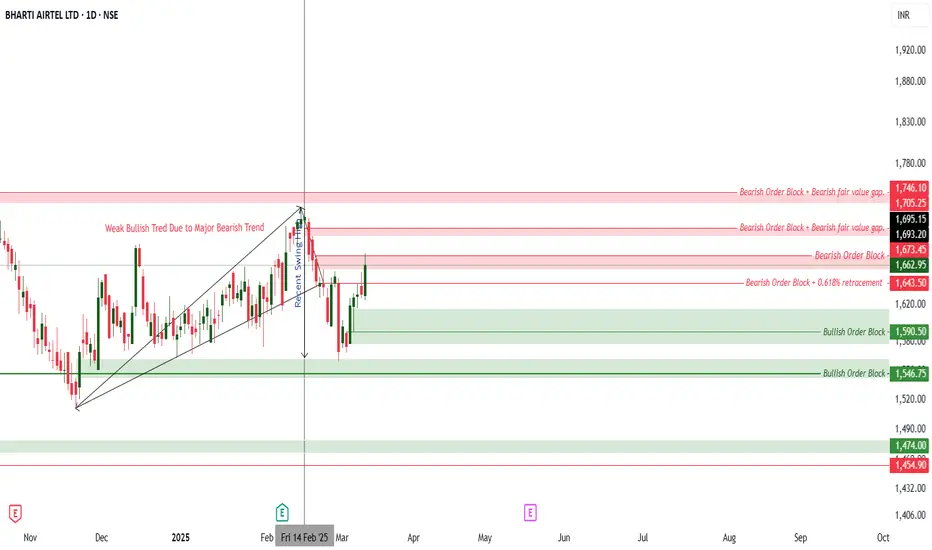
Probability Trade Plan for Bharti Airtel : Latest Daily AnalysisMarket Context & Key Levels
Current Price: 1630.70
Key Resistance Levels: 1643.50 → 1673.45 → 1705.25 → 1746.10
Key Support Levels: 1590.50 → 1546.75 → 1474.00 → 1454.90
🎯 High-Probability 📌 Trade Setup #1: Bearish Rejection from 1643.50
Entry: 1643.50 - 1645 zone (Bearish Order Block & 0.618 retracement). Stop-Loss: Above 1655 (To avoid false breakouts).
*Target 1: 1590.50 (First Bullish Order Block).
*Target 2: 1546.75 (Major Bullish Order Block).
*Target 3: 1474.00 (Final extended target).
💡 Confirmation: If price fails to break 1643.50 and shows bearish rejection candles (e.g., Doji, Engulfing, or Pin Bar), the probability of a drop increases. Doji reformation on week end 7 march 2025
📌 Trade Setup #2: Breakout & Retest Above 1643.50 (Bullish Case)
Trade Type: Buy (Breakout Confirmation)
Entry: Buy above 1650 after a confirmed breakout. Stop-Loss: Below 1630 (Ensuring false breakout protection).
*Target 1: 1673.45 (Next Bearish Order Block).
*Target 2: 1705.25 (Major Resistance).
*Target 3: 1746.10
*(Extended Target if momentum is strong).Probability: Medium to High (Only if price closes strongly above 1645).
💡 Confirmation: Watch for strong bullish candles (Marubozu, Engulfing, or Breakout Retest Structure) above 1645 before entering.
📌 Trade Setup #3: Buy from Strong Support at 1590.50
Trade Type: Buy (Buy on Dip)
Entry: 1590 - 1595 zone (Bullish Order Block). Stop-Loss: Below 1575 (To avoid further downside risk)
*Target 1: 1630.70 (Current resistance).
*Target 2: 1643.50 (Bearish Order Block).
*Target 3: 1673.45 (Major Target).
*Probability: High (Buying near strong demand zones increases chances of a bounce).
💡 Confirmation: Look for bullish reversal candles (Pin Bar, Hammer, or Engulfing Candle) near 1590 before entering.
Disclaimer: This analysis is for educational purposes only and not financial advice. Trading involves risk, and past performance does not guarantee future results. Do your own research, use risk management, and consult a financial advisor before making decisions. Trade at your own risk.
Bharti Airtel LtdBharti Airtel Ltd is one of the world’s leading providers of telecommunication services with presence in 18 countries representing India, Sri
Lanka, 14 countries in Africa. Mobile, Broadband, DTH and Bank.The company has operations in India, Africa, Bangladesh and Sri Lanka
Now what :- Current price near preivious Institutional buying rang. I will wait for a back test or retest the zone after a massive fall. If not go below the level then straight entry.

Airtel Bearish View For Next 3 Months**Bharti Airtel Limited** (commonly known as **Airtel**) is one of India’s largest and most prominent telecommunications companies. It provides mobile services, broadband, digital TV, and enterprise solutions across multiple countries.
### **Key Facts About Airtel:**
- **Founded:** 1995
- **Founder:** Sunil Bharti Mittal
- **Headquarters:** New Delhi, India
- **Chairman:** Sunil Bharti Mittal
- **CEO (India & South Asia):** Gopal Vittal
- **Revenue:** Over **₹1.3 lakh crore** (varies yearly)
- **Stock Listing:** Traded on **NSE & BSE** (Airtel’s stock ticker: **BHARTIARTL**)
### **Major Business Segments:**
1. **Mobile Services** – Offers 4G, 5G, and voice services across **India, Africa, and South Asia**.
2. **Airtel Xstream Fiber** – High-speed broadband and fiber internet services.
3. **Airtel DTH (Direct-to-Home)** – Digital TV services through **Airtel Digital TV**.
4. **Airtel Business** – Provides telecom and cloud solutions for enterprises.
5. **Airtel Payments Bank** – A digital banking service offering UPI, wallets, and savings accounts.
6. **Airtel IoT & Cloud** – Enterprise solutions including cloud computing and IoT (Internet of Things).
7. **Airtel Wynk & Xstream** – Digital content services for music, movies, and OTT streaming.
### **Global Presence:**
Airtel operates in **over 18 countries**, including **India, Africa (under Airtel Africa), and Sri Lanka**. It is one of the largest telecom providers in the world.
### **Competitors:**
- **Reliance Jio** (biggest competitor in India)
- **Vodafone Idea (Vi)**
- **BSNL/MTNL**
- **International rivals** (MTN, Orange, etc. in Africa)
Are you looking for specific information like stock performance, latest news, or business strategies?

Bharti Airtel LimitedBharti Airtel Limited traded at a day low of ₹1218 on June 3, 2024, and from there, it reached an all-time high of ₹1770 on September 26, 2014. The AVWAP from June 3, 2024, has acted as strong support and has held multiple times

Bharti Airtel is in a good buying zoneStock is in good buying zone .any 1 can entre in cmp sl would be below 1626 . Frst target would be 1686 and if it sustain dat price den we can see 1724.
