LONG INTRADAYLong above 45.10 for TGT of 46-47-48... SL 42.20 JUST A VIEW BETTER seek professional advice..
BHEL trade ideas

BHEL BASE FORMATIONBHEL
Note:
1. Views are personal and for educational purposes only. Recheck and take the trade as per your RR.
2. Always remember SL is your lifeline, not the big target...
3.Follow us for more patterns and like, share so that we feel it is helpful to many and share more patterns...
3. Views given here is not a tip rather it is for educational purpose... Aftermarket opens, the condition might change so learn to handle different conditions...
4. To learn more about patterns, Psychology behind the trade, and price action trading... contact us... Thanks...
Keep an eye ladies and gentlemen. Cheers and Happy Trading.


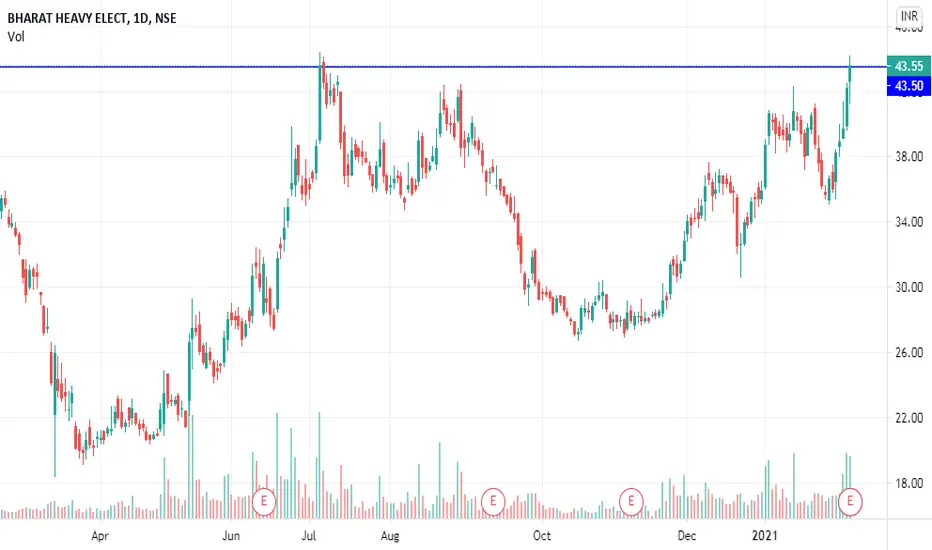
Chart of the Week (06/02/2021)BHEL is our chart of the week and it has given a good breakout above Rs. 42.45 (which is also our Stop Loss). The stock should show good long term target (3 years) of Rs. 190, otherwise one can follow the trendlines as targets that I have drawn on the chart for shorter time frame. But it is prudent to trade on confirmation and hence I would wait for Monday/Tuesday's closing to see if these levels actually hold.


BHEL- CMP 40.5. Cup and Handle pattern followed by consolidationBHEL- CMP 40.5. It made cup and handle pattern which is followed y consolidation. It is in the process of break out. Todays cash volumes are higher than previous 4 days average volumes on increase in price. Today it came out of F&O ban which is a positive sign since trading in F&O is allowed. Today during last hours of trading it went up by making higher ups and higher bottoms, green candles, also closed at day's high. All these are indications for following up buying. It shall break out of consolidation range and shall go to the 42.25, 44.2, 47.45, 52.4, 56.5 with a stop loss of 36.9. This is for educational purpose only any trading shall be done with advice of financial experts.
