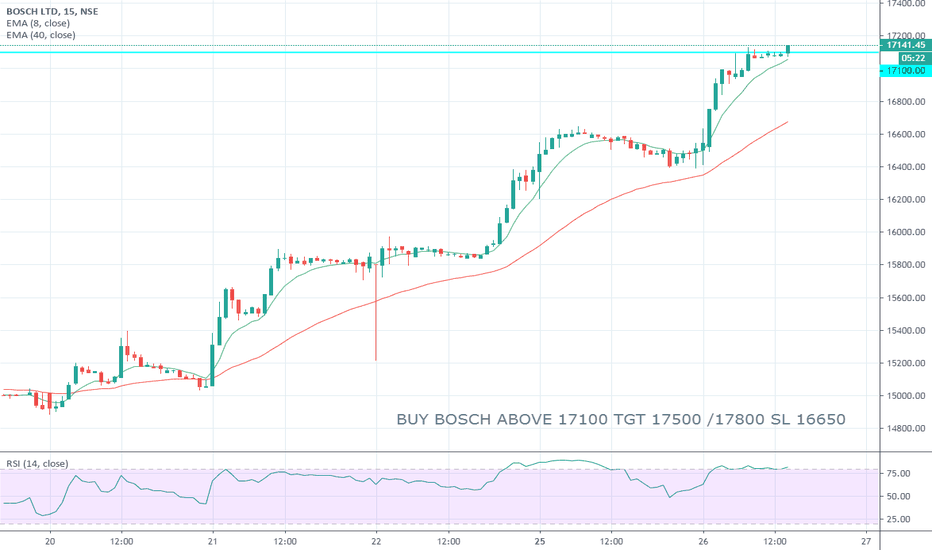
BOSCHLTD trade ideas
boschltd long nov2019bosch ltd chart looks good as it broke last swing high and retracing on support and if it able to sustain then it can give us 17000+, you also can look into chart things are very simple there, lots of resistance upside but RSI showing positive divergence. let's see..
please do your own study before taking any action, it's my personal trading record only.
Bosch Ltd : BuyBuy Bosch Ltd below 14900 stop loss 14200 (hourly closing) target 16300-16600
It is trading in perfect downward sloping parallel channel. 26 week RSI has shown upside cross over. Daily RSI and MACD are showing positive momentum to continue for some more time. Logg scale resistance of falling trend line is at 16200-16400.
We are bullish only for very short term time frame of 15-22 trading sessions. It has to still broke out above falling trendline to signal change in short term trend.
If it moves to 16000 before touching buying zone then this view will be negated.


