BPCL Elliott Wave Analysis – Breakout & Final Impulse UnfoldingKey Insights:
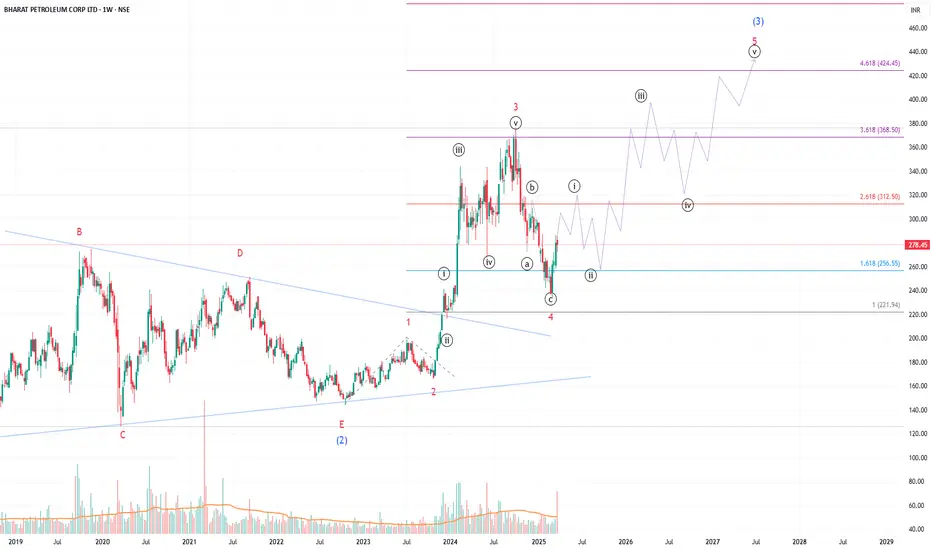
- BPCL broke out of a long-term contracting triangle (A-B-C-D-E) that had been forming since 2018.
- The breakout from Wave E (end of the triangle) triggered a strong impulsive rally, confirming a bullish trend.
- The primary impulse wave (Red 3) peaked, followed by a corrective Wave 4, which appears completed around the ₹256 zone (1.618 Fib).
- Now, BPCL is in the **final impulsive move (Red 5), with a 5-wave structure unfolding inside it.
Technical Structure & Levels:
-Contracting Triangle Breakout**: The breakout signaled the start of a strong uptrend.
- Wave 1 Red 5 is in progress with potential Fibonacci targets at:
- ₹312 (2.618 Fib)**
- ₹368 (3.618 Fib)**
- ₹424 (4.618 Fib)**
- Wave 4 retracement expected before final Wave 5 completion of the larger cycle.
Key Levels to Watch:
🔹 Support: ₹278 (Previous Wave 4 low), ₹256 (1.618 Fib)
🔹 Resistance: ₹312 (2.618 Fib), ₹368 (3.618 Fib), ₹424 (4.618 Fib)
📢 Possible Breakout Confirmation: If BPCL clears ₹312 convincingly, it could accelerate towards ₹368 and ₹424, completing the larger impulsive structure.
🚨 **Disclaimer:** The content shared is for **educational and informational purposes only** and should **not be considered financial advice, investment recommendations, or trading signals**. I am **not a SEBI-registered analyst or advisor**. Always conduct **your own research and analysis** before making any financial decisions. Trading and investing involve significant risk, and past performance is **not indicative of future results**. I may be **completely wrong** in my analysis. Please consult a professional financial advisor before making any investment decisions.
BPCL trade ideas
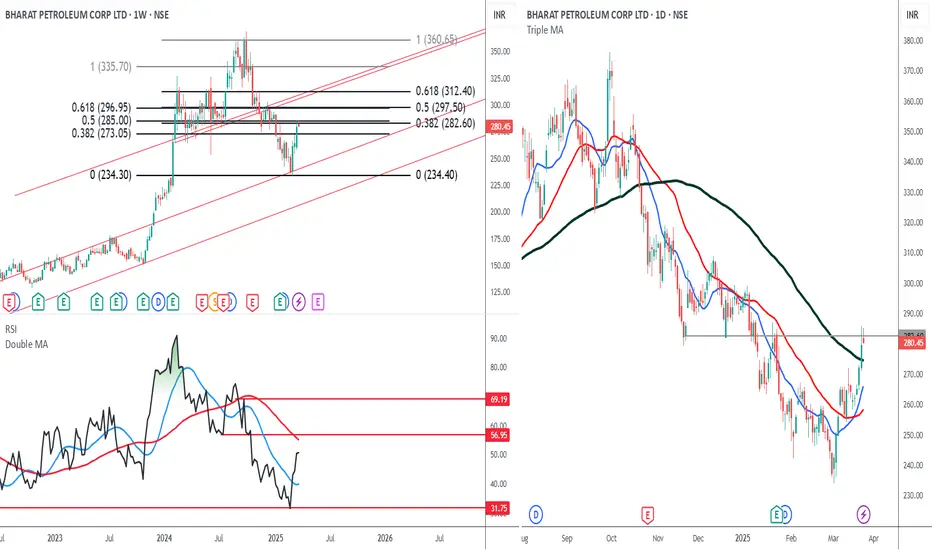
The rally is doneBPCL CMP 280
Elliott- the rally is a bearish zig zag corrective pattern. In my view it is complete.
Fib - the stock is stuck at the first confluence at 282. If it is unable to close above it for one more day then it is a sell.
MA- see how the MA is giving u buy signals where as price analysis is asking u to sell.
Conclusion - the rally is done. Its time to sell it now.
BPCL Stock Analysis & Monday Trade Plan (March 11, 2025)Technical Observations (Based on the Chart)
Resistance Zone:
BPCL is currently facing resistance in the 260-265 range, marked by multiple past rejections.
There are multiple sell signals appearing, indicating potential resistance.
Support Levels:
Immediate support at 256.50.
Stronger support at 248.80.
Major demand zone around 241.50.
Indicator Analysis (RSI & Moving Average) :
RSI at 62.05, showing strength but cooling off from overbought levels.
RSI Orange moving average (likely 50-period) is sloping upwards, indicating bullish momentum.
Price Action:
BPCL has made a strong rally from 235 to 260 and is now consolidating.
If it breaks above 262, further upside is possible.
If it breaks below 256.50, a retracement toward 248-241 is likely.
Trade Plan for Monday (March 11, 2025)
Bullish Trade (Breakout Strategy)
Entry: Buy above 262 (previous high).
Target 1: 265-268.
Target 2: 275 (next major resistance).
Stop Loss: 258 (below minor support).
Bearish Trade (Rejection & Breakdown Strategy)
Entry: Sell below 256.50 (confirmation of weakness).
Target 1: 250.
Target 2: 242 (major demand zone).
Stop Loss: 260.50 (above resistance).
Final Thoughts:
BPCL is at resistance, so a breakout above 262 is needed for bullish confirmation.
A breakdown below 256.50 can trigger a correction toward 250-242.
Monitor market sentiment & volume for confirmation.

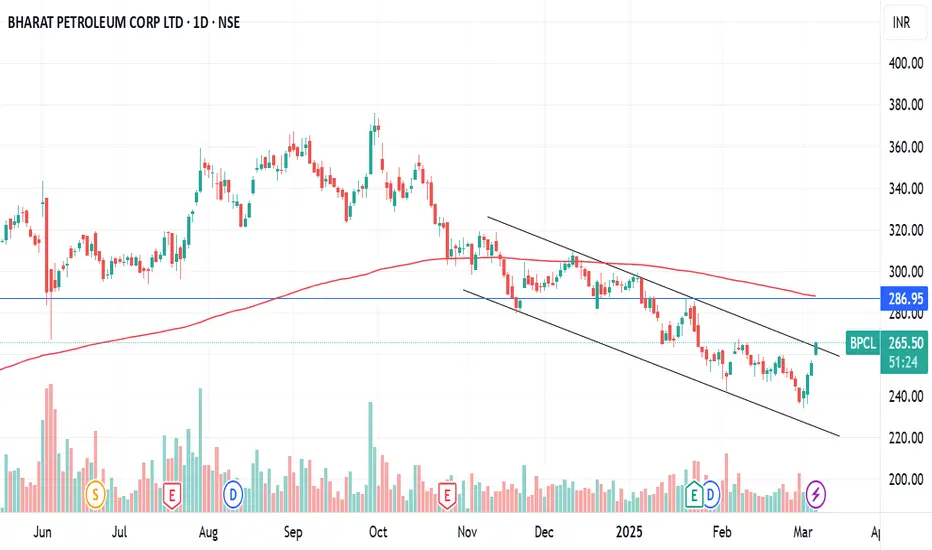
BPCL BREAKING CHANNELBPCL breaking channel with good volume
macd crossover done strong rsi
need to break 265
immediate #target 287
which is 200 ema also
NO BUY/SELL RECOMENDATION
BPCL - Triple bottom continuation1. BPCL - Triple bottom continuation
2. Target yet to reach (3-5 years)
3. High risk-reward ratio

BPCL: Stabilizing After Market Correction Topic Statement:
BPCL has declined in line with the broad market correction but is finding support at key retracement levels, offering an accumulation opportunity for investors.
Key points:
1. The 50% retracement level is acting as a strong support.
2. The price is currently just above the 180-day moving average.
3. While the price may fall to the 61.8% level, investors can consider accumulating at the current 50% retracement level.

At a strong support BPCL CMP 254
Channel - the stock is down to falling channel support.
MA- its also at its longest MA support.
Fib- the current zone is a fib confluence and hence a high prob reversal zone.

BPCL TARGEST PRICE FOR COMING MONTH Wave analysis clearly showing we are going up in pull back of A-B-C we have completed till now A-B now guys ready for 20-30% up move in stock

BPCL Time To Invest At 100 week price Support Bharat Petroleum Corporation Limited (BPCL) is an Indian state-controlled oil and gas company headquartered in Mumbai, Maharashtra. It is a leading player in the country's petroleum industry, engaged in refining, distribution, and marketing of petroleum products. BPCL operates refineries in Mumbai and Kochi, with a combined refining capacity of over 15 million metric tons per year.
Key aspects of BPCL's operations include:
- **Refining**: BPCL refines crude oil into a wide range of products, such as gasoline, diesel, kerosene, and LPG.
- **Marketing**: The company has a large retail network for fuel distribution and a presence in various other segments, including lubricants, aviation fuels, and industrial products.
- **Research & Development**: BPCL invests in R&D to improve its product offerings and efficiency in operations.
BPCL is listed on the Bombay Stock Exchange (BSE) and the National Stock Exchange (NSE) and is majority-owned by the Government of India. The company also focuses on sustainability and has been involved in various environmental and social initiatives.

Bullish at this stage After good fall u can buy call, very cheap and good price u can get decent return
It is forming good bottom.
Not too high not too low

A rally from here likely!BPCL CMP 273.60
Fib- the stock has taken support above the first fib confluence above 268/689. A weekly close above it is a confirmation. In my view it will retrace minimum to 306 which is the 38.2% of the fall which is a good 12% from CMP. The stop has to be below 258.

Bullish harmonic in BPCL in Time frame- WEEKLYSpotted- Bullish harmonic in BPCL in Time frame- WEEKLY
Observe whether it respects the harmonic levels.
Study-Practice-sharing
Educational purpose only.
This is not a recommendation -
I am not SEBI registered - Do not TRADE/INVEST based on what I publish here.
I am not responsible for your loss or gain.

BPCL view for Intraday 11th Jan #BPCL
BPCL view for Intraday 11th Jan #BPCL
Resistance 270 Watching above 286 for upside movement...
Support area 270-280 Below 282 ignoring upside momentum for intraday
Watching below 270 or downside movement...
Above 270 ignoring downside move for intraday
Charts for Educational purposes only.
Please follow strict stop loss and risk reward if you follow the level.
Thanks,

BPCL view for Intraday 10th Jan #BPCL
BPCL view for Intraday 10th Jan #BPCL
Resistance 285 Watching above 286 for upside movement...
Support area 278-280 Below 282 ignoring upside momentum for intraday
Watching below 278 or downside movement...
Above 282 ignoring downside move for intraday
Charts for Educational purposes only.
Please follow strict stop loss and risk reward if you follow the level.
Thanks,

BPCL Levels As of December 26, 2024, Bharat Petroleum Corporation Limited (BPCL) closed at ₹295.50.
Support and Resistance Levels:
Resistance Levels:
R1: ₹299.08
R2: ₹302.57
R3: ₹305.83
Support Levels:
S1: ₹292.33
S2: ₹289.07
S3: ₹285.58
These levels suggest that if BPCL's stock price rises, it may encounter resistance around ₹299.08 to ₹305.83. Conversely, if the price declines, it may find support between ₹285.58 and ₹292.33.
Technical Indicators:
Moving Averages:
5-Day Average: ₹290.60
20-Day Average: ₹295.65
50-Day Average: ₹305.38
200-Day Average: ₹418.84
The stock is trading below its 50-day and 200-day moving averages, indicating a bearish trend.
MACD (12,26,9):
MACD Line: 293.49
Signal Line: 297.32
Histogram: -3.8
The negative MACD value suggests bearish momentum.
ADX (14):
ADX Value: 21.13
+DI (Positive Directional Indicator): 13.78
-DI (Negative Directional Indicator): 21.16
An ADX value around 21 indicates a weak trend, with the negative directional indicator suggesting selling pressure.
RSI (14):
RSI Value: 41.77
An RSI below 50 indicates bearish momentum.
Please note that stock prices are influenced by various factors, and past performance does not guarantee future results. It's advisable to conduct thorough research or consult a financial advisor before making investment decisions.

BPCL Support & ResistanceAs of December 24, 2024, Bharat Petroleum Corporation Limited (BPCL) closed at ₹289.10, reflecting a slight increase of 0.02% from the previous close.
The following support and resistance levels have been identified for BPCL:
Support Levels:
S1: ₹285.10
S2: ₹280.07
S3: ₹275.65
Resistance Levels:
R1: ₹292.00
R2: ₹295.50
R3: ₹298.67
These levels are derived from various technical analyses, including pivot point calculations and moving averages.
MUNAFASUTRA
Please note that support and resistance levels are dynamic and can change based on market conditions.
It's advisable to consult real-time data and consider multiple technical indicators before making any trading decisions.

BPCL Support & Resistance
#BPCL has formed engulfing candle on thursday from important support zone,
Until bpcl is trading above to Market important support zone no need to worry about.
For now it is giving best entry to go positionally in this. 277-280 is going to act strong support zone,

BPCL 1D TimeFrameBPCL prices have tested key support levels three times now. At this point, it's crucial to wait and observe how the price action unfolds. While technical analysis can provide insights, predicting future market movements with certainty is impossible. If someone claims they can, more power to them.
Below is an analysis of the chart and current price action. However, please remember to consult with your financial advisor before making any investment or trading decisions.


At a good supportThis stock too has halted at fib support and has strength. This stock is still a good buy here. The bear candle on the monthly chart is the only sign of weakness on this chart. We will see the rally and take a call whether to hold or exit the rally.

Bharat Petroleum Corporation LimitedBharat Petroleum Corporation Limited
Cmp 285 tar open
sl 265
Rsi Positive Divergences seen

BPCL 1D TFNSE:BPCL is 2/2 stock that I missed to post on Oct - 21.This stock has been trading near the trend line and has broken it and went downwards. As Nifty was also moving on the downside, this short position is traded and is still running towards take profit
Disclaimer:- This analysis is only for educational purpose. Please always do your own analysis or consult with your financial advisor before taking any kind of trades

BPCL looks good around 319 322 levelsA long trade can be initiated in BPCL around 320 levels with sl around 303 305 levels for target of 330++ 350++ 375++ 415++ levels
