CANFINHOME trade ideas

Short Entry in CANFINHOMESAs per Volume analysis Looks Like CANFINHOME will give Small Negative Trend if its break 882-880 level.
If canfinhomes breaks mention level then possibly it will test 870-865 level.
Will wait for for entry to get execute.
Only For Educational Purpose.

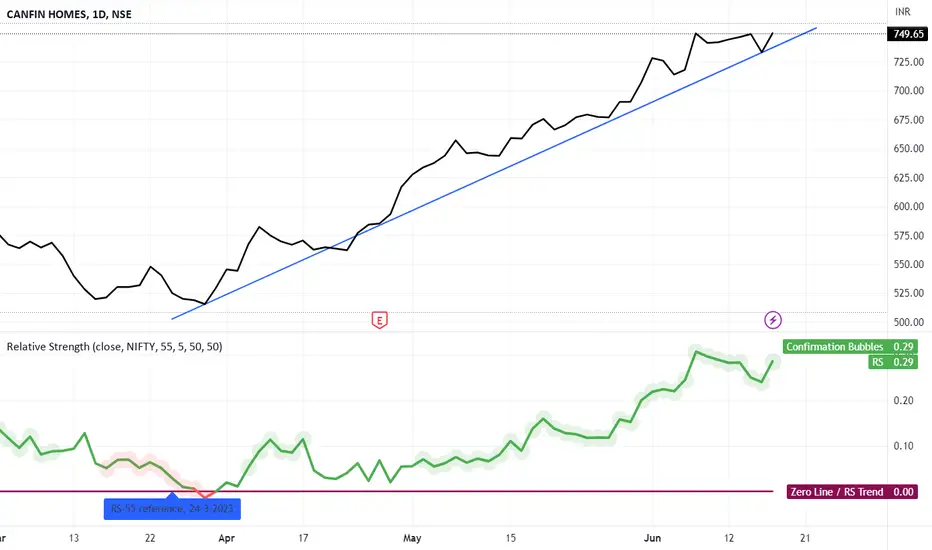
Canfin Homes is at buying levels - holding trendline supportEntry - 750
SL - Close below 729
First target - 795, then can be trailed
CANFINHOMES to take long entryLong Canfin above the BO as marked on the charts. High probability that the stock will bounce back again. Shortly levels 0f 775-800 can be seen. This is for your educational purpose only.

Bullish flag pattern breakout in CANFINHCANFIN HOMES
Key highlights: 💡⚡
✅On 1 Hour Time Frame Stock Showing Breakout of Bullish flag Pattern .
✅ Strong Bullish Candlestick Form on this timeframe.
✅It can give movement up to the Breakout target of 855+.
✅Can Go short in this stock by placing a stop loss below 772-.

CANFINHOME
Price has given decisive breakout above its resistance around 700.
In its history, price has at least tested the 161.8% FR level or the 261.8% FR level.
So the up-move is likely to extend to at least 950, and 1400 on optimistic basis.
Bullish view remains valid as long as prices stay above 660.

weekly based - bearish eyeing for bearish side for next week plus july series
reasons -
weekly based bearish engulfing pattern
daily based RSI divergence
1st tgt looking at 710-707
disclaimer - trade @ own risk

CANFINHOME - Cup n Handle breakout - 45% upside potentialCANFINHOME has given cup and handle breakout on weekly timeframe.
Target: 950 then 1150.
SL: Daily candle close below 720
Note: This stock has been in correction (time and price) since last 5-6 years and given good breakout which is positive sign and stock has potential to give multi-fold (1x,2x,3x) returns over next 1-2 years.

CanFin Homes - Flag Pole BreakoutCanfin Home :
Looks a good Flag Pole Breakout
Strong support at 740

CANFIN HOMES TARGET 947CANFIN HOMES monthly and weekly raising wedge breakout with bullish.Long-term breakout from the previous high. Very good bullish retracement in weekly and daily charts. Sector performance is also very good. Target 947. Stop loss 725

Sell Canfin Homes below 730Sell Canfin Homes below 730 target 724, 719. Reason for Sell, RSI has become weak also have tested 732 level 4 times so the level has become weak, close below 730 will give downside move to 724,719,709.
Please Note I am not SEBI registered advisor, this is just my view and is for educational purpose. Please consult your financial advisor before taking trade.

CANFIN HOMES 15 MINCANFIN HOMES Looking good for upside..
When it break level 741 and sustain.. it will go upside...
Target
1st 752
2nd 763
Enjoy trading traders.. Keep add this STOCK in your watch list..
Investor are welcome..

LONG CANFINHOMES Breakout from a weekly resistance, buy above 756, seeing an upside till 927. This is for Idea purpose only, I am not a SEBI Reg. analyst. Do your own research before investing. Comment if you have any questions regarding this.

CanFinHome: Weekly Chart Analysis Signals Bearish MomentumIn this technical analysis article, you can examine the CanFinHome weekly chart and evaluate various indicators and patterns to gain insight into potential price movements. We focus on horizontal resistance, Elliott wave theory, daily RSI, anti-shark patterns and price action to estimate the future direction of the stock price.
Weekly horizontal resistance:
The first significant observation on the Can Fin Homes weekly chart is the presence of a pronounced horizontal resistance level. This level creates an obstacle to price gains and often results in stock trend reversals. Traders and investors should monitor this level closely as it could put strong selling pressure on stocks.
Completion of the Elliott Wave:
Based on Elliott Wave theory, Can Fin Homes appears to have completed the 5th wave. According to this principle, 5 waves are usually completed followed by a correction phase. This indicates a possible stock trend reversal, increasing the likelihood of a downtrend.
Daily Overbought RSI Range:
The Daily Relative Strength Index (RSI) is an important momentum indicator that helps identify overbought and oversold conditions. In the case of Can Finn Holmes, the RSI on the daily chart is in overbought territory, indicating that the stock may face a downside or consolidation phase. This further underscores the pessimistic outlook for the stock.
Weekly shark action chart pattern:
Another notable pattern on the weekly chart is the presence of anti-shark patterns. A variation on the famous shark pattern, this pattern features a rapid drop in price followed by a strong reversal. An anti-shark pattern suggests that stocks may fall before a potential upside reversal.
The price spread suggests a premium zone around 720:
Analyzing price movements on the weekly chart, we can see that Can Fin Homes is hovering around the 720 level. This points to the existence of a potential premium zone where sellers can start to dominate and push prices down. Traders should closely monitor price action around this level for further confirmation.
Trading settings:
Based on the analysis of the indicators and patterns above, the possible trade setups are:
Entry: 697
Goal 1: 679
Goal 2: 663
Stop loss: 719
Conclusion:
In summary, Can Fin Homes' weekly chart-based technical analysis points to bearish momentum for the stock. The presence of horizontal resistance, the completion of the 5th Elliott Wave, the daily RSI in the overbought region, the anti-shark pattern, and price action suggesting a premium area around 720 all point to a potential downside for the stock. However, it is important to remember that technical analysis is not absolute and traders should always consider other factors and risk management strategies before making a trading decision.

CANFINHOME - Ichimoku Bullish Breakout Stock Name - Can Fin Homes Limited
Ichimoku Cloud Setup :
1). Today's close is above the Conversion Line
2). Future Kumo is Turning Bullish
3). Chikou span is slanting upwards
All these parameters are showing bullishness at Current Market Price
and more bullishness AFTER crossing 733
#This is not Buy and Sell recommendation to any one. This is for education purpose and a helping hand to learn trading in Market.
# Cloud Trading
# Ichimoku Cloud
# Ichimoku Followers
I hope you all like my analysis.
Please do share your thoughts into comment section.
Please give a like, share & subscribe for daily analysis.

Cup & Handle Pattern Breakout in Canfin HomesBuy @ 728
Target 813-1064
SL 481 (stay above for at least 15 min.)
CMP @728 June 01, 2023
Chart by CA Savita Rehlan


CANFINHOMECANFINHOME broke out of triangle pattern with decent volumes on an hourly TF charts.
Could be bought with mentioned stoploss & target.

CANFIN HOMES LOOKS GOODCan fin homes looks after breaking a falling resistance trendline on weekly chart and gives a close above so we can consider it is breakout of triangle resistance trendline and after a breakout of falling resistance trendline we can go long in it for the target of 704 taking stop loss of 618 below a weekly candle close.
TARGET AND STOP LOSS
𝑵𝑶𝑻𝑬- 𝑶𝑵𝑳𝒀 𝑭𝑶𝑹 𝑬𝑫𝑼𝑪𝑨𝑻𝑰𝑶𝑵 𝑷𝑼𝑹𝑷𝑶𝑺𝑬

CANFINHOME Buy @ 696.5Entry 696.5
Qty 50
SL 687 (1℅)
Price broke major resistance on higher time frame.
Took medium sized position as stoploss is very thin
Waiting for more traction to add further accordingly

CANFINHOME Loking for a bullish!Breakout from bullish symmetrical triangle
and formation of a bullish divergence.

Continuation Diamond and Flag Pattern formation On Daily Chart two patterns has been noticed recently in CANFIN HOMES: Continuation Diamond (Bullish) and Flag (Bullish)
Continuation Diamond (Bullish) - explanation
The script canfinhome previously experienced a period of consolidation where the price moved within a specific range. However, the price has now broken out of this range in an upward direction, indicating that the previous uptrend is likely to continue. This breakout occurred after a pattern of higher highs and lower lows, followed by a narrowing of the trading range. This pattern is known as a broadening formation or a diamond pattern, and its upward breakout confirms the continuation of the previous uptrend.
Flag (Bullish) - explanation
The script canfinhome has recently experienced a strong upward movement, and although there was a temporary pause, the price is now continuing its upward trend at a rapid pace. This pause is often seen in a bullish Flag pattern, which is a pattern that occurs during a strong market rally. This pattern is characterized by two parallel trend lines that typically slope downward in the opposite direction to the prevailing uptrend. The bullish Flag pattern is confirmed when the price breaks through the upper boundary of these trend lines, indicating that the upward movement is likely to continue.
Conclusion:
downtrend looks minimal before reaching resistance.
Note for everyone who came across this study:
This chart is only for educational purpose.
This is not buying or selling recommendations.
I am not SEBI registered.
Please consult your financial advisor before taking any trade.

CANFINHOME Positional Tradebased ON data and strong Breakout! my view FII/DII are active for buying. delivery and momumtum also Good buying from 560.
