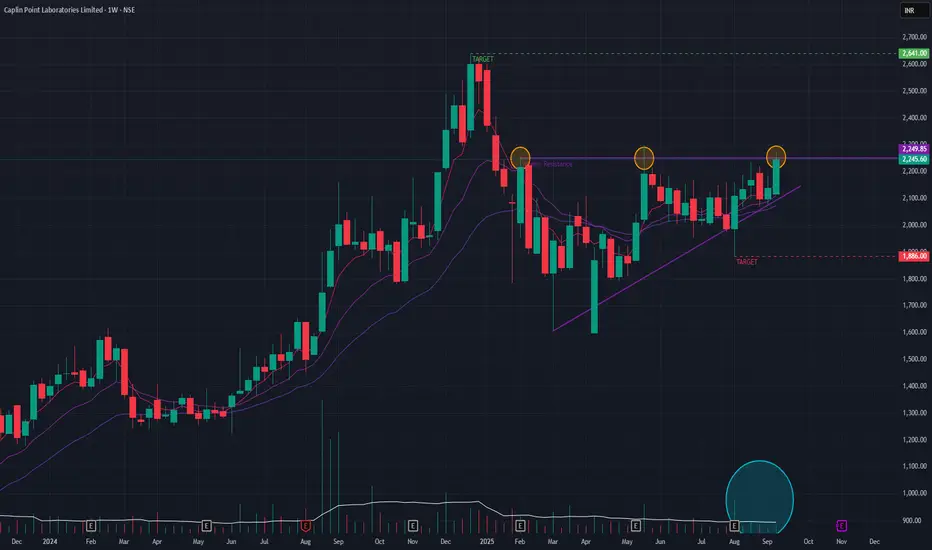
Caplin Point (Weekly Timeframe) - Will the uptrend continue ?After a brief downtrend, Caplin Point has formed a classic triangle pattern , which often acts as a continuation signal for the preceding long-term uptrend. Technical indicators are favorable, with the short-term EMAs arranged in a bullish formation that signals strong underlying momentum.
The one element of caution is that recent trading volumes have been average. Therefore, a breakout from the triangle must be accompanied by a significant increase in volume to validate buyer conviction. If such a breakout occurs, the next logical objective would be the all-time high, which also serves as a key resistance zone at ₹2640 . Conversely, if the pattern fails and momentum wanes, a pullback to the ₹1886 support level is possible.
Watchout for the price-action !!
CAPLIPOINT trade ideas
CAPLIPOINT Price ActionAs of July 31, 2025, Caplin Point Laboratories Ltd (CAPLIPOINT) is trading near ₹2,085, showing a mixed but steady performance with some recent price fluctuations around this level. The stock briefly touched intraday highs around ₹2,095 and lows near ₹2,030, maintaining support in the ₹2,030–₹2,055 range. Market capitalization stands broadly near ₹15,590 crore.
Caplin Point benefits from solid fundamentals in the pharmaceutical sector, supported by consistent revenue growth and operational efficiencies. The price-to-earnings ratio sits around 29, while the price-to-book ratio is approximately 5.5, indicating premium valuation relative to book but in line with sector expectations. Dividend yield is low at about 0.15%, reflecting the company’s focus on growth over payout.
Technically, the stock tends to hover above its medium-term moving averages like the 50-day and 200-day SMAs, showing cautious bullish momentum, although near-term volatility remains. Trading volumes are moderate, and the relative strength index is near mid-range levels, suggesting balanced momentum without overbought or oversold extremes.
Overall, Caplin Point Laboratories currently reflects steady fundamentals with a valuation premium typical of its pharma peer group, supported by stable trading ranges and positive medium-term technical signals. The near-term outlook remains cautiously optimistic, with key support near ₹2,030 and potential resistance around ₹2,100–₹2,120.
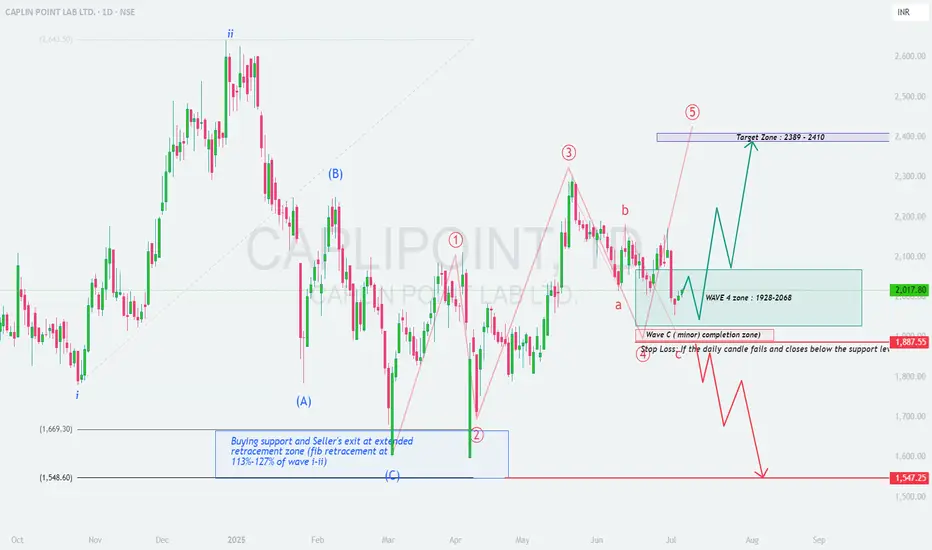
CAPLIPOINT : A Textbook Elliott Wave Correction Unfolding
\ Timeframe:\ Daily
\ Structure:\ Corrective to Impulsive
\ Type:\ Educational Swing Setup
---
🔍 \ 1. Context and Background:\
CAPLIPOINT has exhibited a classic 5-wave impulsive rally followed by a correction phase, aligning neatly with \ Elliott Wave Theory\ . Currently, the stock appears to be in \ Wave 4 correction\ – often a shallow, sideways or ABC-type pattern – preparing for a potential \ Wave 5 impulse\ .
---
📈 \ 2. Wave Structure Breakdown:\
* \ Wave 1 to Wave 3\ completed with good strength.
* \ Wave 3\ peaked near \ ₹2390\ , showing signs of extension.
* The ongoing \ Wave 4 correction\ seems to be forming a textbook \ ABC pattern\ :
* \ Wave A and Wave B\ completed.
* \ Wave C\ likely completed or very close to completion inside the support zone.
---
🟦 \ 3. Wave 4 Correction Zone – ₹1928 to ₹2068:\
This zone offers a \ high-probability reversal area\ supported by:
* \ 38.2%–50% Fibonacci retracement\ of Wave 3.
* Confluence with \ previous consolidation\ support.
* Price action showing \ long wicks and small candles\ , signaling accumulation or demand.
---
🟥 \ 4. Wave C and Critical Support – ₹1887:\
* ₹1887 is likely the \ end of Wave C\ and the complete ABC correction.
* Based on:
* \ 113%–127% Fibonacci extension\ of Wave A (classic C-wave completion area).
* Strong \ volume spike and price rejection\ near this zone.
---
🟪 \ 5. Wave 5 Target Projection – ₹2389 to ₹2410:\
Projected using:
* \ Fibonacci extension\ of Wave 1 from Wave 4 low.
* \ Measured move technique\ .
* Target aligns with previous resistance around \ Wave 3 top at ₹2390\ .
---
🛑 \ 6. Stop Loss & Invalidation Level:\
* \ Invalidation below ₹1887\ on a daily close.
* A close below this would signal a potential \ deeper correction\ toward ₹1547–1660 zone.
---
✅ \ 7. Strategic Swing Trade Plan:\
* \ Entry Zone:\ ₹1930 – ₹2065
* \ Stop Loss:\ ₹1887 (daily close basis)
* \ Target 1:\ ₹2250
* \ Target 2:\ ₹2389–2410 (projected Wave 5 zone)
---
### 🧠 \ 8. Why This Setup is Educational:\
* \ Textbook Elliott Wave Pattern:\ Classic 5-wave setup with ABC correction.
* \ Fibonacci Confluence:\ Retracement and extensions align perfectly.
* \ Price Action Validation:\ Support zone showing bullish characteristics.
* \ Defined Risk-Reward:\ Excellent R\:R with tight SL.
* \ Momentum Potential:\ Wave 5 often brings sharp, fast moves—ideal for swing setups.
---
📌 \ Conclusion:\
CAPLIPOINT is completing a clean \ Wave 4 correction\ and preparing for its \ final impulsive Wave 5\ . If \ ₹1887\ holds, the stock may target \ ₹2389–2410\ in the coming sessions. A technically rich and structurally strong swing opportunity for serious traders and wave enthusiasts.
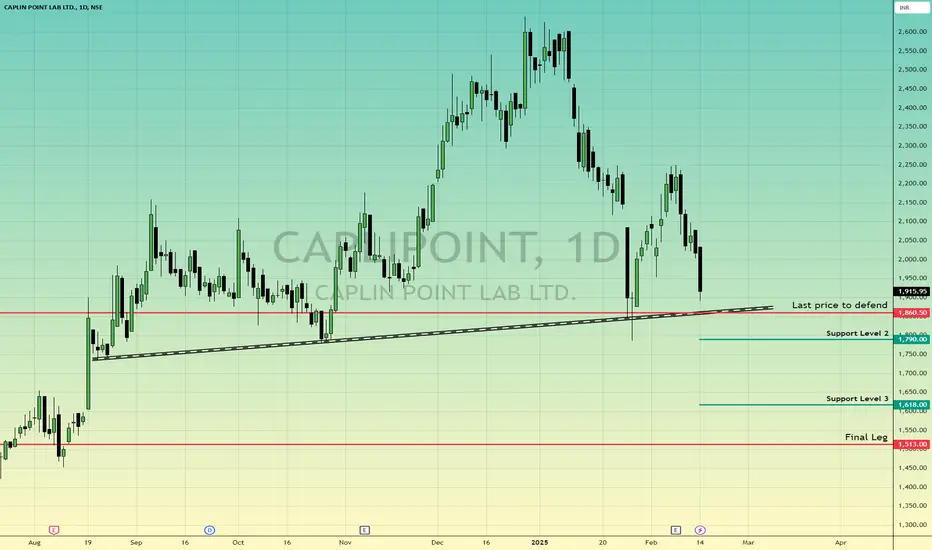
CAPLUPOINT - Analysis Fundamentals are goods. Not to miss the company when price is getting at lower price.
FIIs & DIIs have increased there stake in the company last 3 quarters.
Price getting at the trendline support and 1860 is level of defense, if broken than much lower price can be seen in coming days which can be blessing for long term / Mid term investment.
Price to look for buying are marked.
Do your research before investing
Happy Investing
Girish Anchan
W.M.A
Ride the trend reversal for CaplinStock name: Caplin Point Lab.
Structure: Very bullish and consolidating.
Idea behind the trade: Good Tap into weekly OB showing signs of reversal by impulse move to the upside leaving volume imbalance zones. Also healthy pullback.
Waiting for the next minor pullback on key levels of VI and FIB for sniper entry.
Ride the trend till the potential sell zones. Can also push it to the high to be aggressive. (Trail your SL to make the most of it)

caplinpointsector is about at consodilate level
keep on radar for long at given level
only for education purpose

CAPLIPOINT
Flag & Pole Breakout: The stock is breaking out of a classic Flag & Pole pattern, supported by strong volume, indicating a continuation of bullish momentum.
All-Time High Close: Price has closed at its all-time high, reinforcing the strength of the breakout.
Relative Strength: Relative strength against Nifty is robust, showcasing the stock's outperformance in the current market conditions.
Action Plan
Consider entering the stock with a stop-loss (SL) set as per your risk appetite to protect against volatility.

CAPLIPOINTCAPLIPOINT giving resistance breakout. Its a clear base setup with decent volume. Get ready for the next ride. I built 1st position nr 1550 level and not its trading nr 2600.

Swing Trading BUY OPPORTUNITY IN CAPLIPOINTRefer the chart for Entry,Target and SL.
NOTE: This trade is only for Equity Swing buy and not to be considered for options trading.
Please do follow Position Sizing and Risk Reward Ratio while planning any trades.
Note: This information is for education purpose only and please do your own research and consult your financial advisor prior to taking any action.
TO CONNECT WITH ME CHECK OUT MY BIO.
If you like this Idea, Please do like my ideas and share it with your friends. check my bio.
Please boost my ideas and send cheers as it acts as a motivation to keep posting my analysis.
Thank you


Stocks to watch Stocks to watch
CAPLIPOINT
+ VCP in progress
+ Strong Prior uptrend
+ Trading above Key EMAs
+ Rising Sales & EPS growth
Disc : Charts are shared for educational Purposes only.

CAPLIN POINT LAB - ATH Breakout StockTrying to Breakout of ATH price level for the 4th time.
Volume picking now.
fundamental looks good.
It could be a big winner after breakout of ATH.

Higher Volume Breakout for this fundamentally strong company.CAPLIN POINT
High Volume Breakout and retesting
with lower volume shows a clear entry for
higher target.

Best Chart Formation Caplin Point
- Great Result
- Weak hand removed in the last few session
- If it sustain above 1620 we can expect big up move
- Strong Bullish Volume formation

Caplin Point - Attractive buy Fundamentals
MCAP- 12000Cr
PE - 25.04 < Induustry PE of 27
PEG Ratio is 1.18
Debt to Equity is 0 and ICR is 1077+
ROE is 23%, ROCE is 20% ( 5yr ROCE is 28%)
Sales growth is 16%, 5yr Sales growth is 21%, Sales increased straight in last 12 qtrs
Profit Growth is 21%, 5yr Profit growth is 21%, net profit increased straight in last 12 qtrs
Promoter holding is rock solid , 70%
Latest results - As per estimates, no surprise
Technicals
CMP - 1576
Bullish - Above EMA 9, 21,63, 200
Forming ascending triangle , near breakout in daily charts
Also forming cup and handle in daily charts
Target :
As per fundamentals = 1700
As per cup and handle = 1950 (1600+350)
Disclaimer : Not SEBI registered. Views are for educational purposes only

BUY TODAY SELL TOMORROW for 5%DON’T HAVE TIME TO MANAGE YOUR TRADES?
- Take BTST trades at 3:25 pm every day
- Try to exit by taking 4-7% profit of each trade
- SL can also be maintained as closing below the low of the breakout candle
Now, why do I prefer BTST over swing trades? The primary reason is that I have observed that 90% of the stocks give most of the movement in just 1-2 days and the rest of the time they either consolidate or fall
Trendline Breakout in CAPLIPOINT
BUY TODAY SELL TOMORROW for 5%

Amazing breakout on Weekly / Daily Timeframe - CAPLIPOINTCheckout an amazing breakout happened in the stock in Weekly timeframe, macroscopically seen in Daily timeframe. Having a great favour that the stock might be bullish expecting a staggering returns of minimum 25% TGT. IMPORTANT BREAKOUT LEVELS ARE ALWAYS RESPECTED!
NOTE for learners: Place the breakout levels as per the chart shared and track it yourself to get amazed!!
#No complicated chart patterns
#No big big indicators
#No Excel sheet or number magics
TRADE IDEA: WAIT FOR THE STOCK TO BREAKOUT IN LOWER TIMEFRAME AND RETRACE IF NEEDED. SL IS NEARER SUPPORT ZONE IN Daily TIMEFRAME.
PS: No new Nifty500 script can escape from me when making a breakout. :-)

VIEW ON CAPLINPOINTBreakout on the stock
Stock at all time high
Target 1720/1900
Stop loss 1550
I am just representing my views
For educational purpose only.

CAPLIPOINT LONG 1530-1545, CUP AND HANDLEBullish Indicators:
Ascending triangle pattern.
Trading above key moving averages (20-day, 50-day, and 200-day).
Potential cup and handle formation.
RSI is bullish but not overbought.
Volume spikes on upward movements.
target 1: 1596
target 2: 1800+
Note: I am not SEBI registered or TA expert. just learning the TA and sharing my views and you should consider doing research on your own before making any investment decisions.
Finished Trades (1/1)
JUBLINGREA - Target hit in 4 sessions (check out it in ideas section)


Pharma Stock on Radar!!!Hi Guys !!!
The price has given a cup and Handle pattern breakout with good volume. The entry can be done on current level for the target of 1620 and 1712. The view will be positional.
The stock name is Caplin point laboratories
Pls follow and give boos to my idea.


BIGBULL bReAkOuT A Weekly Bullish Flag and Pole pattern is visible on the charts of NSE:CAPLIPOINT
Flag and Pole pattern is a bullish continuation pattern and it is visible in charts after a meaningful apprication in the NSE:CAPLIPOINT
MACD gave Positive crossover on Daily chart and Monthly chart and weekly chart, it is on verge of giving positive breakout So, expecting the momentum to continue.
One can look to create a fresh position in the scrip near Rs. 1190 levels with the stoploss of Rs. 1090.45 on weekly closing basis. The 1st target will be 1293.10 , 2nd target will be 1397.10 and 3rd target will be 1499.20.
