Capri Global Capital LtdDate 10.10.2025
Capri Global
Timeframe : Weekly Chart
About
(1) Diversified Non-Banking Financial Company
(2) Segments like MSME, Affordable Housing, Construction Finance segments, Car Loan & Gold Loans
Company Timeline
(1) FY11 : Construction Finance Business
(2) FY13 : MSME Lending
(3) FY17 : Housing Finance
(4) FY22 : Car Loans & Gold Loans
MSME
(1) Avg. Ticket size Rs. 17 lakhs
(2) Tenor: Up to 15 years
(3) AUM : 38%
Housing Finance
(1) Avg. Ticket size: Rs. 11 lakhs
(2) Tenor: Up to 25 years
(3) AUM : 26%
Gold Loans
(1) Ticket size: Rs. 3,000 to Rs. 30 lakhs
(2) Tenor: Up to 1 year
(3) AUM : 16%
Construction Finance
(1) Avg. Ticket size: Rs. 7 crs
(2) Tenor: Up to 7 years
(3) AUM : 17%
Indirect Lending
(1) Ticket size: Rs. 3 crs. - 1,00 crs.
(2) Tenor: Up to 3 years
(3) AUM : 3%
Geographical Presence
(1) Maharashtra: 5%
(2) Delhi: 11%
(3) Gujarat: 18%
(4) Madhya Pradesh: 32%
(5) Rajasthan: 31%
(6) UP : 3%
(7) Punjab & Haryana: 1%
Capital Adequacy Ratio
(1) Capri Global Capital Ltd : 32%
(2) Capri Global Housing Finance Limited : 48%
Valuations
(1) Market Cap: 18079 Cr
(2) Stock PE: 31.3
(3) ROCE: 11.2%
(4) ROE: 11.8%
(5) Sales Growth: 39.73%
(6) Profit Growth: 98.16%
Regards,
Ankur Singh
CGCL trade ideas

Small Cap Finance sector is in imp juncture(Capri Global)Capri global has posted strong good quaterly results and now showing strength after correction. Rate cuts might help finance stocks and this stock can turn dark horse. It is a small cap company. Not a good thing to take high exposure.
Keep it in watchlist. Good chances of breaking the resistance line.
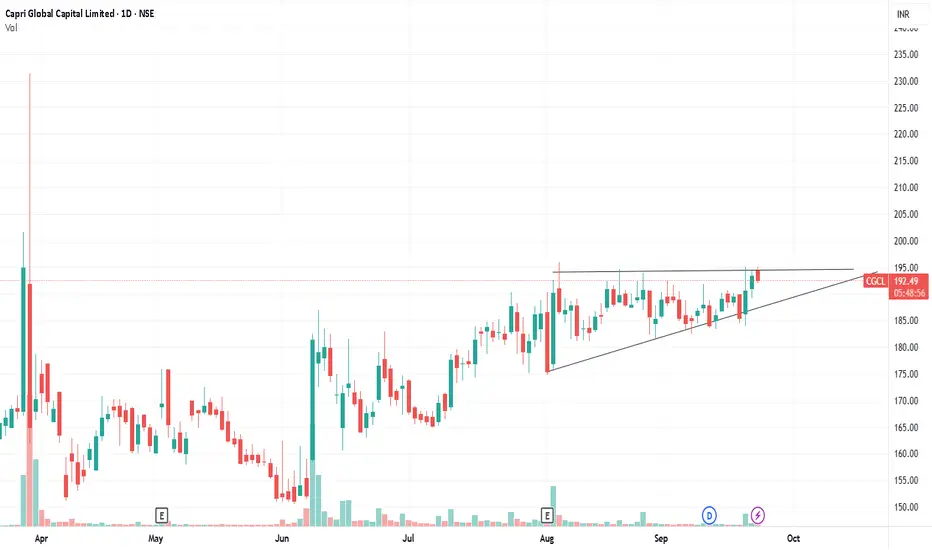
Capri Global Capital LtdCGCL stock, previously in a downward-sloping channel, has now broken above its upper trendline, which could signal a potential trend reversal.
It is currently trading above key moving averages, including the 50-day EMA at 185.4 and the 200-day EMA at 175.7, indicating sustained upward momentum. We're observing higher lows, with solid support consistently holding around the 185 mark.
Volume levels confirm buying interest, and technical indicators like the RSI are neutral to mildly bullish, further supporting continued momentum.
If the stock sustains above 195, targets of 215 and 230 appear achievable.

Capri Global Capital LtdAfter a downward fall stock created a good bottom and and also round bottom and price is shifting up and today with a good volume it breaked the past barriers ,,, so we can see some powerfull upward move in this stock

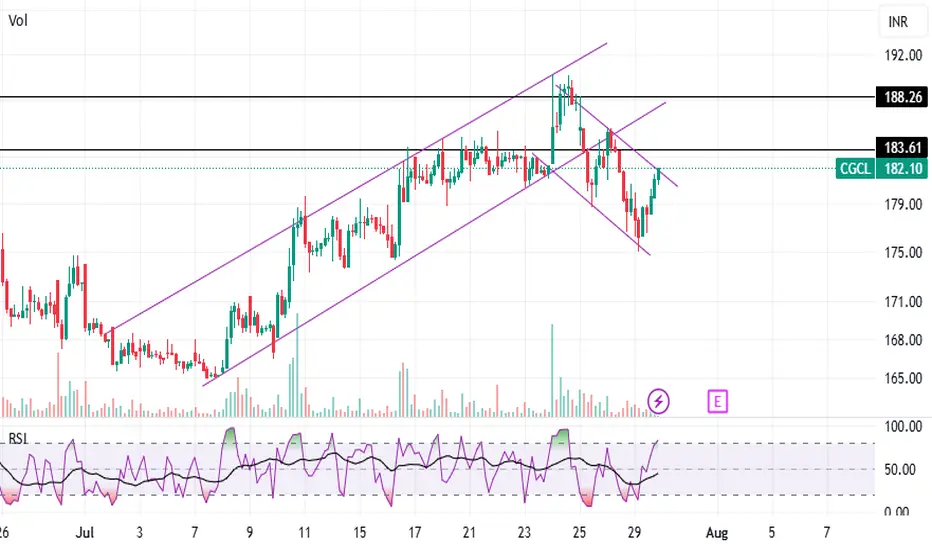
Capri Global Capital Ltd - Short term CGCL - The stock was moving in an ascending channel. It recently broke out of that ascending channel, indicating a short-term bearish reversal.
After the breakdown, the price formed a falling wedge. Now it looks like it’s breaking out upwards from the wedge, confirming bullish momentum resuming.
Volume is moderate, with a slight uptick during the breakout, which confirms buyer interest.
Consider if the price sustains above 183 with the targets of 188 and 192
bullish setup spotted on CGCLCapri Global is a diversified Non-Banking Financial Company (NBFC) with a presence across diverse segments like MSME, Affordable Housing, Construction Finance segments, and Car Loan distribution; forayed into Gold Loans in Aug 22
Company is expected to give good quarter
Company has delivered good profit growth of 24.3% CAGR over last 5 years
Company's median sales growth is 31.5% of last 10 years
Capri-Global Capital ltdMarket making signs showing in capri-global
Not a buying/selling recommendation/Not suggested. keep this in watchlist, if anyone buying hold for the target of 250, current market price is 176.20
Again not a buying/selling recommendation/not suggested.

CAPRI GLOBAL Please consult your financial advisor before investing.This is only for learning purpose of chart.
We are NISM certified EQ and MCX trader but not SEBI register investment advisor...
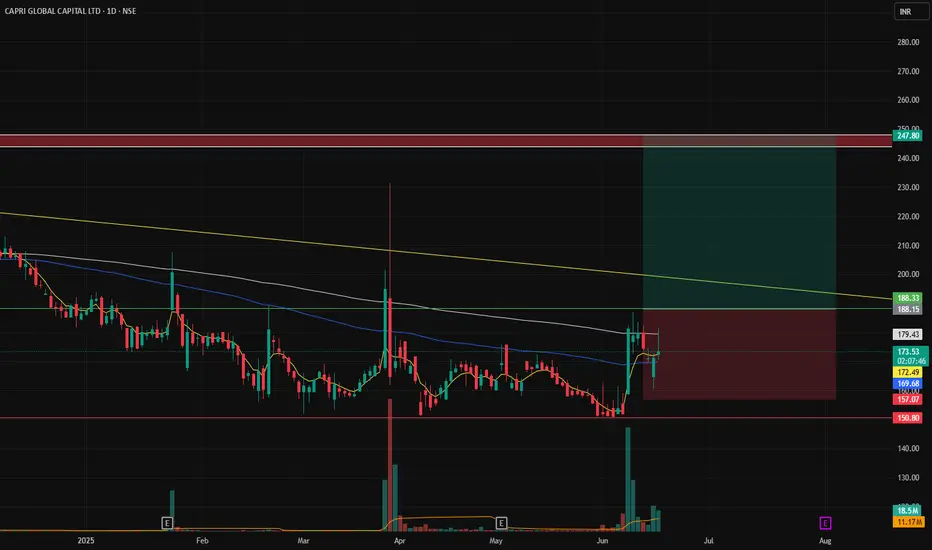
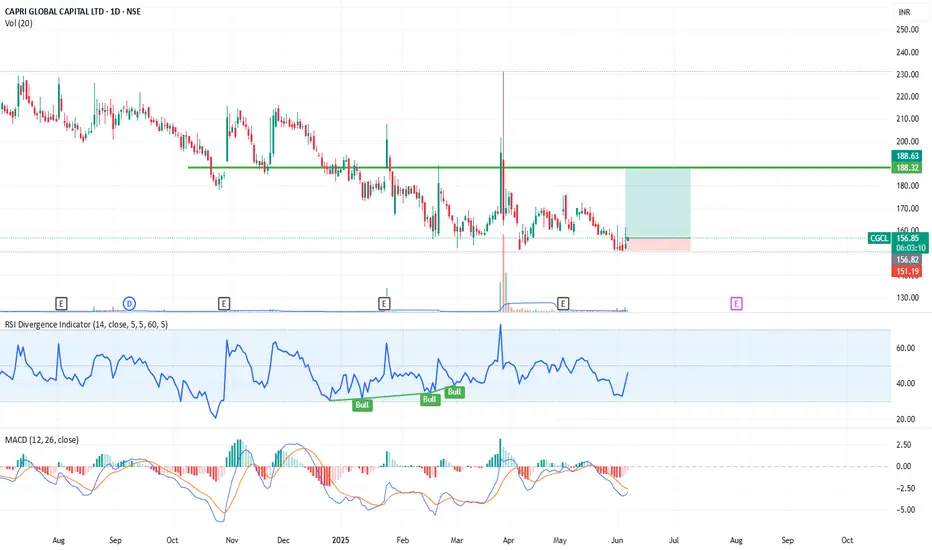
CGCL (Capri Global Capital Ltd) – Possible Reversal from SupportShort Analysis:
Chart Pattern: The stock is currently trading near a strong horizontal support zone (~₹151–₹155), tested multiple times.
RSI: Shows bullish divergence around 45, indicating potential upward momentum.
MACD: Close to a bullish crossover, signaling a possible trend reversal.
Volume: Slight rise in volume supports the current bounce attempt.
Risk/Reward: Marked risk zone below ₹151.19 and possible target area around ₹188.
Note: This is not a recommendation, only for study purposes. Do your own analysis and apply proper risk management before making any trading decisions.
BUY TODAY SELL TOMORROW for 5%DON’T HAVE TIME TO MANAGE YOUR TRADES?
- Take BTST trades at 3:25 pm every day
- Try to exit by taking 4-7% profit of each trade
- SL can also be maintained as closing below the low of the breakout candle
Now, why do I prefer BTST over swing trades? The primary reason is that I have observed that 90% of the stocks give most of the movement in just 1-2 days and the rest of the time they either consolidate or fall
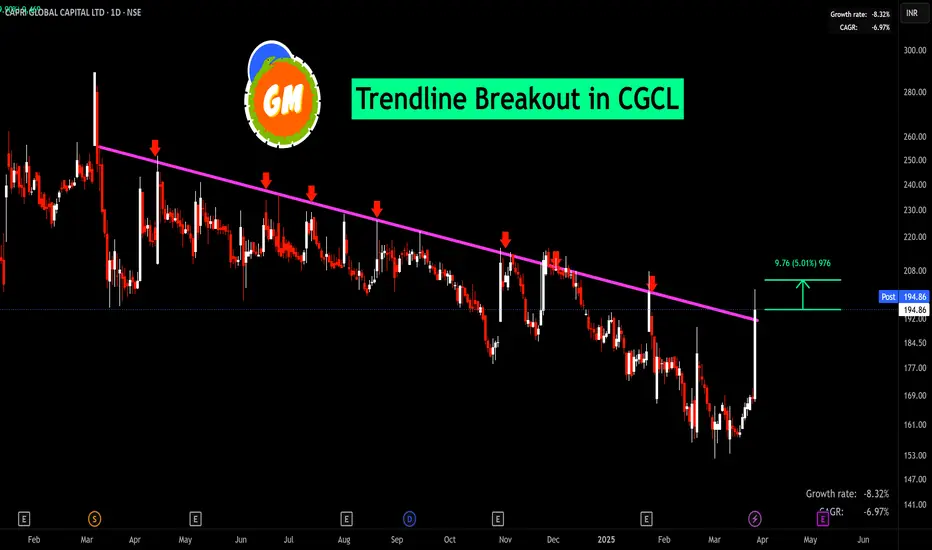
Trendline Breakout in CGCL
BUY TODAY SELL TOMORROW for 5%

BUY TODAY SELL TOMORROW for 5%DON’T HAVE TIME TO MANAGE YOUR TRADES?
- Take BTST trades at 3:25 pm every day
- Try to exit by taking 4-7% profit of each trade
- SL can also be maintained as closing below the low of the breakout candle
Now, why do I prefer BTST over swing trades? The primary reason is that I have observed that 90% of the stocks give most of the movement in just 1-2 days and the rest of the time they either consolidate or fall
Trendline Breakout in CGCL
BUY TODAY SELL TOMORROW for 5%
2 Amazing swing trading ideas for 27 Jan 2025I daily make educational content videos for swing / positional trading

High Delivery Volume Not Meant For Bullishness Watch Carefully! When there is **high delivery of shares at a higher price**, it might intuitively seem bullish because it indicates strong buying interest. However, this scenario does not always mean a bullish outlook. Here's why:
### 1. **Distribution by Smart Money**
- **What happens:** Institutional investors or smart money (like mutual funds or big players) may offload their holdings at higher prices when retail investors or traders rush to buy, believing the stock will go higher.
- **Why it's not bullish:** This often signals that the "smart money" believes the stock has reached or is close to a peak in the short term and is using the demand to sell their holdings.
---
### 2. **Profit Booking**
- **What happens:** After a strong rally, many investors take profits at higher prices, leading to increased delivery volumes.
- **Why it's not bullish:** The high delivery does not indicate fresh buying but rather the transfer of shares from long-term holders to short-term traders, which could lead to a correction or consolidation.
---
### 3. **Trap for Retail Investors**
- **What happens:** In some cases, large players might intentionally create artificial demand by pushing prices higher, only to sell their holdings to retail investors (this is often called a "bull trap").
- **Why it's not bullish:** Once the selling pressure begins, the price tends to drop, leaving latecomers (retail investors) stuck with expensive shares.
---
### 4. **Exhaustion of Demand**
- **What happens:** At higher prices, most buyers may already have entered the market, leaving fewer participants to push the price higher.
- **Why it's not bullish:** With demand exhausted, selling pressure can easily dominate, causing the price to stagnate or fall.
---
### 5. **Sector or Market Context**
- **What happens:** Broader market or sector weakness might lead investors to lock in profits, irrespective of the stock's fundamentals.
- **Why it's not bullish:** High delivery at higher prices might only reflect temporary interest due to broader market sentiment and not sustainable growth.
---
### Key Indicators to Confirm the Trend:
- **Price Action:** Look for sustained upward momentum in price with high delivery. If prices are stagnating or declining despite high delivery, it signals bearish sentiment.
- **Volumes:** Rising volumes with falling prices and high delivery often indicate distribution.
- **Open Interest (in derivatives):** Increasing open interest in short positions along with high delivery at higher prices signals bearish views.
---
### Conclusion:
High delivery volumes at higher prices need to be analyzed in conjunction with other factors like price movement, broader market sentiment, and institutional activity. Without these confirmations, it could simply indicate profit booking, distribution, or a bull trap—none of which are bullish signals.

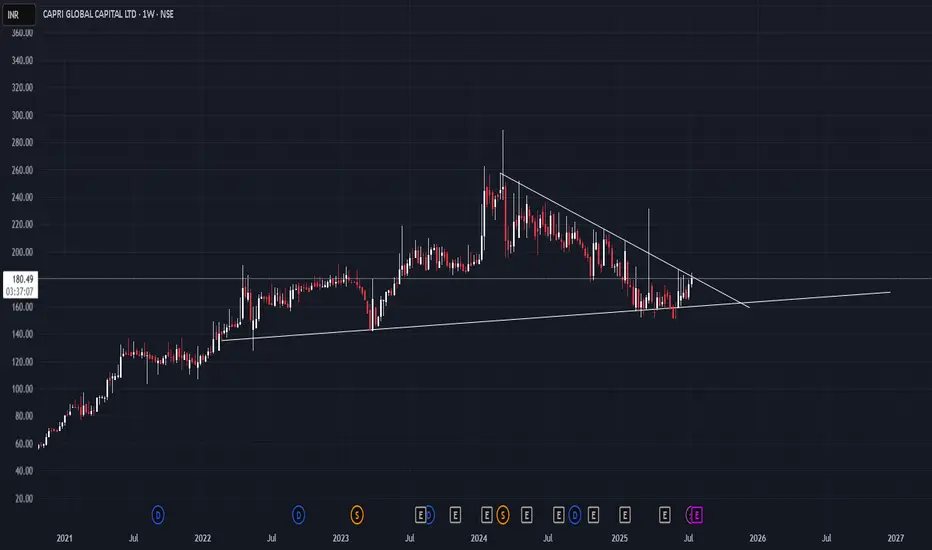
Amazing breakout on Weekly Timeframe - CGCLCheckout an amazing breakout happened in the stock in Weekly timeframe, macroscopically seen in Daily timeframe. Having a great favor that the stock might be bullish expecting a staggering returns of minimum 25% TGT. IMPORTANT BREAKOUT LEVELS ARE ALWAYS RESPECTED!
NOTE for learners: Place the breakout levels as per the chart shared and track it yourself to get amazed!!
#No complicated chart patterns
#No big big indicators
#No Excel sheet or number magics
TRADE IDEA: WAIT FOR THE STOCK TO BREAKOUT IN LOWER TIMEFRAME AND RETRACE IF NEEDED. SL IS NEARER SUPPORT ZONE IN Daily TIMEFRAME.
Checkout an amazing breakout happened in the stock in Weekly timeframe.
Breakouts happening in longer timeframe is way more powerful than the breakouts seen in Daily timeframe. You can blindly invest once the weekly candle closes above the breakout line and stay invested forever. Also these stocks breakouts are lifelong predictions, it means technically these breakouts happen giving more returns in the longer runs. Hence, even when the scrip makes a loss of 10% / 20% / 30% / 50%, the stock will regain and turn around. Once they again enter the same breakout level, they will flyyyyyyyyyyyy like a ROCKET if held in the portfolio in the longer run.
Time makes money, GREEDY & EGO will not make money.
Also, magically these breakouts tend to prove that the companies turn around and fundamentally becoming strong. Also the magic happens when more diversification is done in various sectors under various scripts with equal money invested in each N500 scripts.
The real deal is when to purchase and where to purchase the stock. That is where Breakout study comes into play.
LET'S PUMP IN SOME MONEY AND REVOLUTIONIZE THE NATION'S ECONOMY!

CGCL - Breakout and Monring StarPrice consolidate in 185 range since July 2023 and it breakout the black color trendline wtih good volume and greend candle looks good in weekly timeframe until today. We can expect short rally in this stock with stoploss at 185.

Capri global capital - Descending triangle breakoutDescending triangle breakout in Capri global capital

cgcl swing ideaCGCL looking good made triangle pattern on daily time frame got multiple time rejection on trendline if close daily candle above 226 it will good for swing trading
NOTE: only for educational purpose
RULE: 1: always trade with stoploss
2: decide your risk per trade and per day
3: believe to your analysis
4: stay positive and keep patience
technical analysis + money management+ physicalogy = successful trader
pls like and share

CGCLCgcl Chart Analysis .........20/06/24
CGCL Long : 220,
Sl : 195
Target : 243 / 262 / 290 / 314
Correction has come in CGCL shares and then consolidation or breakout and retest has taken place, therefore the shares should be traded on the upside.
Enjoy!

CAPRI BLOBALgood opportunity for long term invester and intraday trader also
buying zone after treand line break

[Swing Trading] CGCLCGCL seems to be in consolidation from a week. Will it give BO? I'm expecting a run from here till 250ishh.. I recommended others to do their research and take the trade.

Buy cgcl for a target of 330Buy cgcl for a target of 330
Stop loss of daily close below 195
Time frame 1-2 months
Target of 270 can be expected in 20 days same sl

25% Upside on Capri Global Capital Fundamental Study
1. Company having given All Time High Net Profit
2. Company is diversified Non-Banking Financial Company (NBFC)
3. Market Cap > 18k cr
4. Price to book value < 5
5. Promoter holding approx 70%
Technical Study
1. Without any news company fall more than 30%
2. Even if we wait and buy still upside of more than 25%
Entry Signal
If the stock price sustain above 224 then BUY SIGNAL
If stock price goes below 216 then setup needs to be revised

Capri Global-A breakout you shouldn't miss!Stock has been consolidating in a range from many days.Volume breakout has happened today.
Stock should sustain above 850 for couple of days for confirmation.
Levels mentioned on chart. Highly risky trade.
