Swing Trade in CIPLA Rising wedge Reversal Pattern In CIPLA 1 Hour TIME FRAME, And Breakout . Sell:- 1132, Stoploss:- 1150, Target:-1100,1070, This swing Trade For Only Next 1 week.
CIPLA trade ideas

Cipla still showing strength We added Cipla and it never looked back despite this huge volatility! As trailing SL has never hit, we are still holding.🤠
This week also gave an ATH breakout and is ready for the next leg!
Targets: 1338, 1447, and more
SL: 1005, Weekly Close
Disclaimer: This is for educational purposes only, not any recommendations to buy or sell. As I am not SEBI registered, please consult your financial advisor before taking any action.

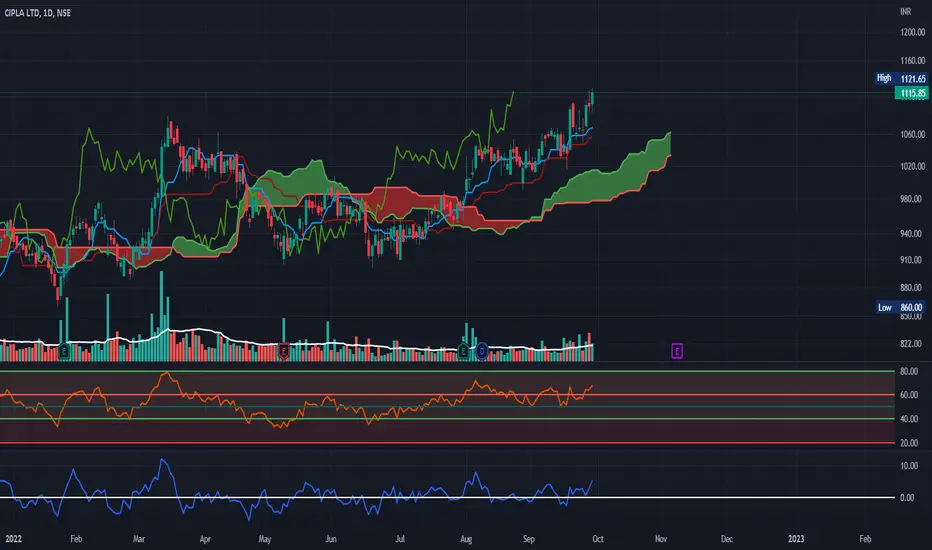
CIPLA - Ichimoku Bullish Breakout Stock Name - Cipla Limited
Ichimoku Cloud Setup :
1). Today's close is above the Conversion Line
2). Future Kumo is Turning Bullish
3). Chikou span is slanting upwards
All these parameters are showing bullishness at Current Market Price
and more bullishness AFTER crossing 441
#This is not Buy and Sell recommendation to any one. This is for education purpose and a helping hand to learn trading in Market.
# Cloud Trading
# Ichimoku Cloud
# Ichimoku Followers
I hope you all like my analysis.
Please do share your thoughts into comment section.
Please give a like, it motivates me to do analysis.
CIPLA INTRADAY ANALYSISDue to global uncertainty defensive counters such as pharma are being focused on by both the FII's and the retail investors. Cipla has shown strength in these times. It has broken the resistance levels of Rs 1081.55 but went for a retest and consolidated below it after a second continuation of up trend the prices have closed above the resistance level. As prices move above Rs 1105 with confirmation on smaller time frame of 5 or 15 min charts, a buy can be initiated.


CIPLAThis is only for education purpose only. Please check your own analysis before you take a trade


Cipla LtdCipla Ltd Looks Bearish
1) All Time High Rejection
2) Bull Trap are there
3) Cipla Ltd Makes Market Structure Type 1
4) Also, Making "M" Pattern ( Advanced Double Top) after crossing of 1050
5) As per Fibonacci Target was 1025-1020
6) Risky Trader Take Entry on this price level or wait for 1050
Note: Its just for a Knowledge do your analysis is based on your knowledge and money management

CIPLA ZIGZAG CORRECTIONcipla is in wave c of zigzag correction, target can be seen towards 1019, one can also trail their position, on purple lines.

CIPLA BUY NOWDon't miss the great Breakout BUY Opportunity in CIPLA.
Wait for retracement the buy.
Entry: 1085
TP: 1100
SL: 1080
RR: 1:3 Reward


CIPLAhead and shoulder = breakout TRG r open like swing trader
for MORE check in my TradingView ID
If You LIKE MY Idea ……Boost………….. its
“Disclosure : I am not Sebi-registered.” This channel is for only educational purpose. Any profit/loss, I am not responsible.
Before taking any trade on our calls, please consult your financial advisors. Thanks

CIPLA may reach to 2037CIPLA may reach to 2037 as long as it stays above upper triangle trendline.
User discretion!! for learning only!

CIPLA - Ichimoku Bullish Breakout Stock Name - Cipla Limited
Ichimoku Cloud Setup :
1). Today's close is above the Conversion Line
2). Future Kumo is Turning Bullish
3). Chikou span is slanting upwards
All these parameters are showing bullishness at Current Market Price
and more bullishness AFTER crossing 1100
#This is not Buy and Sell recommendation to any one. This is for education purpose and a helping hand to learn trading in Market.
# Cloud Trading
# Ichimoku Cloud
# Ichimoku Followers
I hope you all like my analysis.
Please do share your thoughts into comment section.
Please give a like, it motivates me to do analysis.

Cipla, dual parallel channel pattern formationWait for breakout on either side of inside channel.
Target Upper channel.

15 Sept | Nifty Banknifty Prediction |Best stocks to trade 15 Sept | Nifty Banknifty Prediction |Best stocks to trade

Cipla trade setup The stock is moving in a range and can give a good move . Keep this setup on radar - once closes above 1080 can give positional good target . and Types of Pattern Cup and Handle Disclaimer: This idea is for educational purpose and kindly buy as per your risk

CIPLA W TIME FRAME.CIPLA........... in daily time frame_ near to all time high , after breaks a green candle & close 1080 level with volumes ...


CIPLACIPLA LOOING GOOD FOR LONG as it has made a good base after BO and now sustain the price above it

Cipla Ltd. (CIPL)breakoutlevelCipla Ltd. (CIPL) @breakout level
Strong breakout with volume break out and momentum created in day chart.
breakout for long. so strong upside are coming.
BUY above 1052
NEXT TARGET 1067.40,1092.40,1110.3
Time to go for long, get ready to catch the profit. Thank you.

CIPLA-RETESTED RESISTANCECIPLA has retested all time high resistance.
It is consolidated nearly 1 and half years.
Current RSI IS 63.
Retested the resistance line.So there is high probability that it will move forward.
You can decide S.L. and target as per your strategies.
Above information is given for the educational purpose only. Do your own analysis.

CIPLA INTRADAY STOCK TRADING PROFITKINDLY SWITCH TO 5MIN TIME-FRAME
Used past analysis to find support and resistance level on 15min time frame.
Once marked, waited for breakout or breakdown.
As Cipla breakout, ON 5min Time-frame. A fake breakout green candle formed. And hence reversed back.
Again breakout on 5min Time-frame, then waited for pullback back. A Hammer candle formed at 10:25.
As price break that candle, I took my trade with SL at blue Line.
Hence profit booked.
What if didn't go my way?
Simple take my stop-loss. Because we can increase chances of profit by some analysis. But no analysis is 100% perfect. Just obey stop-loss or Take profit.
You will be profitable.
