DCAL - Swing Buy - Strength Buy+ Momentum ShiftDCAL - Strength Buy+ Momentum Shift
key observations
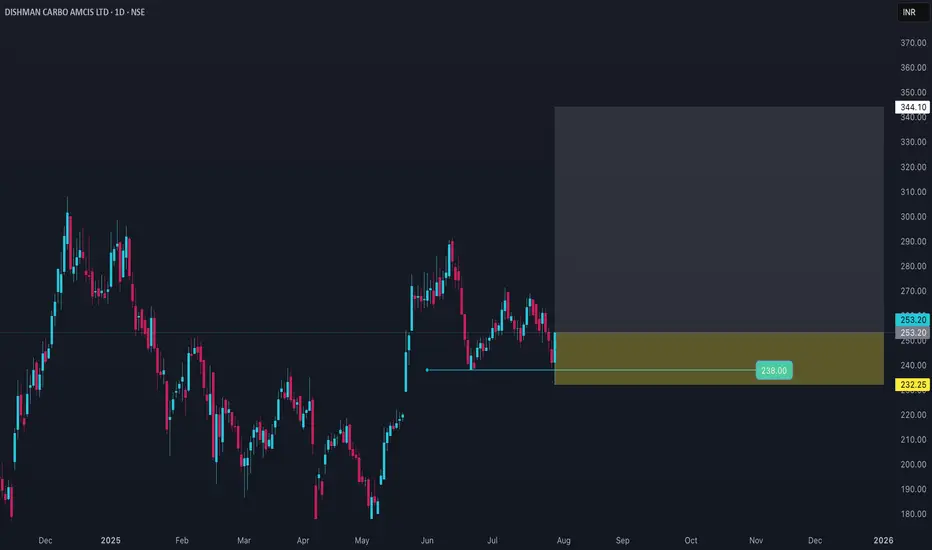
1. near its all time high
2. 52 week high BO
3. Vcp Pattern formation
4. rising Strenght
5. Momentum Shift
Support= 260
Resistance = 393
Trade ideas

DCAL Price ActionAs of July 29, 2025, Dishman Carbogen Amcis Ltd (DCAL) is trading around ₹253.20, showing an intraday price range between ₹232.25 and ₹253.20. The stock opened at ₹241.15 and is currently in an uptrend with average traded price near ₹246.15. Market capitalization is approximately ₹3,970 crore. The stock has experienced volatility but appears to be gaining momentum in recent sessions with strong trading volumes.
### Price and Trend
- Recent price movement shows recovery with steady intraday gains and bullish momentum.
- The stock is trading below its 52-week high of around ₹308 but above its 52-week low of ₹155.
- Technicals indicate the stock is in an upward phase, supported by positive sentiment.
### Financial and Valuation Highlights
- DCAL’s price-to-earnings ratio tends to be low or near zero, reflecting either fluctuating profitability or losses.
- The company operates in the healthcare sector, focusing on contract research and manufacturing services (CRAMS) in pharmaceuticals.
### Outlook
The current technical trend suggests potential near-term strength if volume and price momentum sustain. However, given the mixed historic earnings and sector dynamics, monitoring quarterly results and sector developments is advisable for a clearer long-term outlook. Investors should also consider volatility and valuation metrics before positioning.
In summary, DCAL is showing signs of a bullish uptrend around ₹250–₹255 with moderate liquidity and market cap near ₹4,000 crore, suitable for investors looking for exposure in the pharmaceutical CRAMS segment with a medium risk appetite.
BUY TODAY SELL TOMORROW for 5%DON’T HAVE TIME TO MANAGE YOUR TRADES?
- Take BTST trades at 3:25 pm every day
- Try to exit by taking 4-7% profit of each trade
- SL can also be maintained as closing below the low of the breakout candle
Now, why do I prefer BTST over swing trades? The primary reason is that I have observed that 90% of the stocks give most of the movement in just 1-2 days and the rest of the time they either consolidate or fall
Resistance Breakout in DCAL
BUY TODAY SELL TOMORROW for 5%

Breakout @ DCAL
STOCK: DCAL
SETUP: Price was hitting the same level of 250 to 260, gave breakout in 2024, and failed now price trading above recent swing.
VOLUME: Volume is high
PLAN: Entry: Above high volume candle 305 to 307, Stop: 255 to 250, Target: 1:2
NOTE: MANAGE YOUR RISK # FOR LEARNING PURPOSES ONLY
NOTE: WILL NOT UPDATE ON SETUP, TAKE STOP OR TARGET

DCAL #long #swingtradeAlready out of large base
recent quarter triple digit eps growth
consolidating and maintained on 21ema in recent week downfall

DCALNear All Time High
Good Fundamentals
Flag and Pole pattern
Resisting fall.
Risk reward shown on the chart.


Dishman Carbo amcis LTD Dishman Carbo amcis LTD manufactures and supplies marketable molecules such as specialty chemicals, vitamins & chemicals and disinfectants with presence in Switzerland, UK, Europe, China and other countries.
Breakout and retested
1. Entry at 228
2. Target - 269
3. Stoploss - 220

Amazing breakout on Weekly Timeframe - DCALCheckout an amazing breakout happened in the stock in Weekly timeframe, macroscopically seen in Daily timeframe. Having a great favor that the stock might be bullish expecting a staggering returns of minimum 25% TGT. IMPORTANT BREAKOUT LEVELS ARE ALWAYS RESPECTED!
NOTE for learners: Place the breakout levels as per the chart shared and track it yourself to get amazed!!
#No complicated chart patterns
#No big big indicators
#No Excel sheet or number magics
TRADE IDEA: WAIT FOR THE STOCK TO BREAKOUT IN LOWER TIMEFRAME AND RETRACE IF NEEDED. SL IS NEARER SUPPORT ZONE IN Daily TIMEFRAME.
Checkout an amazing breakout happened in the stock in Weekly timeframe.
Breakouts happening in longer timeframe is way more powerful than the breakouts seen in Daily timeframe. You can blindly invest once the weekly candle closes above the breakout line and stay invested forever. Also these stocks breakouts are lifelong predictions, it means technically these breakouts happen giving more returns in the longer runs. Hence, even when the scrip makes a loss of 10% / 20% / 30% / 50%, the stock will regain and turn around. Once they again enter the same breakout level, they will flyyyyyyyyyyyy like a ROCKET if held in the portfolio in the longer run.
Time makes money, GREEDY & EGO will not make money.
Also, magically these breakouts tend to prove that the companies turn around and fundamentally becoming strong. Also the magic happens when more diversification is done in various sectors under various scripts with equal money invested in each N500 scripts.
The real deal is when to purchase and where to purchase the stock. That is where Breakout study comes into play.
LET'S PUMP IN SOME MONEY AND REVOLUTIONIZE THE NATION'S ECONOMY!

DCAL - BullishDCAL is bullish for a short term swing.
1) 50 DMA > 200 DMA
2) Price > supertrend 14,3
3) Forming higher HI since last 3 days.
4) BO after consolidation
Targets 285, 325, 378
This view is for academics and not advice for BUY

DCAL forming inverse H&S. Keep on the Radar.
-Good Volume today.
-Forming inverse H&S pattern.
-Dry volume when pulling back.
Watch for a breakout above 214. SL is very deep for positional players. Position size accordingly.
Aggressive players can try placing SL below today's candle (196-day closing basis).
The market is on a downtrend. The chances of fake breakouts are very high. Please do your due diligence. This is not a buy/sell recommendation.

DCAL: Symmetrical Triangle Pattern BreakoutDCAL has recently exhibited a noteworthy breakout from a symmetrical triangle pattern on the daily timeframe, accompanied by a corresponding increase in trading volume. The stock price has successfully breached the upper trendline of the symmetrical triangle, a development that is often indicative of bullish momentum. Such a breakout, supported by substantial volume, suggests a likely continuation of upward price movement.
The MACD signal line has crossed above the MACD line, a bullish signal that reinforces the potential for further upward price action. This crossover indicates increasing momentum and buying strength. The RSI is currently reading above 85, suggesting that the stock is in overbought territory. While this may indicate strong buying interest, it is also a signal to monitor for potential overextension in the price movement.
Based on the current technical indicators and chart patterns, a position around the price level of 194 . A stop-loss order is suggested at 180 to manage risk effectively. The target price for this trade is estimated at 223 , providing a favourable risk-reward ratio of approximately 1:2.
Disclaimer: This technical analysis report is provided for informational and educational purposes only. It should not be interpreted as financial advice or a recommendation to buy or sell any security. Individuals should conduct their own thorough research and/or consult with a financial advisor before making any investment decisions.

DCAL - Strong Resistance Breakout on Daily ChartDCAL has broken out of the ₹200–₹212 resistance zone with strong bullish momentum.
A gap-up breakout ("Run Away Gap Created") is accompanied by a significant increase in volume, signaling strong buyer interest.
Higher Lows (HL):
The chart shows consistent higher lows, indicating a strong uptrend and accumulation phase prior to the breakout.
Stage 2 Breakout:
The price has entered a new stage of momentum, with potential targets at higher resistance levels (₹240 and ₹254).
Support Levels:
Immediate support is at the breakout zone of ₹190–₹200.
Stronger support lies at the upward trendline near ₹180.
Trade Setup for Next Week:
Entry Point:
Ideal entry is ₹212–₹215, post breakout confirmation, ensuring the price sustains above the resistance zone.
Targets:
First Target: ₹240 (minor resistance area).
Second Target: ₹254 (major resistance, "Stage 2 Breakout Level").
Stop-Loss:
Place a stop-loss just below the breakout level at ₹190, as a breach would invalidate the breakout.
Exit Plan:
Short-term traders: Exit around ₹240.
Medium-term traders: Hold for ₹254, using a trailing stop-loss to secure profits.

Dishman Carbo Amics cmp 212.53 by Weekly Chart since listed*Dishman Carbo Amics cmp 212.53 by Weekly Chart since listed*
- Resistance Zone 247 to 260 Price Band
- Stock Price well above the EMA 21, 50, 100, 200 with favorable RSI & MACD
- Weekly basis : Support at 181 > 148 > 109 with the Resistance at 247 > 284 > 321
- Falling Resistance Trendline and Resistance Zone needs to be broken for fresh upside momentum to kick in
- Multiple Bullish Rounding Bottoms + Cup and Handle formed with most recent Rounding Bottom in the completion process
- Stock Price closure above Resistance Zone with supportive Volumes increase may provide fresh upside breakout probability

DCAL - Potential C&H -Back in Profits. Buy above 215.DCAL is forming Cup & Handle Pattern.
One can enter above 215 with target of 255/400/600/780, with Stop Loss of 171.
Here's a summary of the key points for investors from Dishman Carbogen Amcis Limited's (DCAL) presentation for Q2 FY25:
Financial Highlights
1. Revenue Growth: Net revenue for Q2 FY25 increased by 34.5% YoY to ₹7,890 million, driven by a boost in commercial sales, particularly in the CRAMS (Contract Research and Manufacturing Services) segment in Switzerland and India.
2. Profitability: EBITDA rose significantly to ₹1,485 million with a margin increase from 10.8% in Q2 FY24 to 18.8% in Q2 FY25, due to higher volumes and improved operating margins.
3. Cash Profit: Cash profit for Q2 FY25 stood at ₹1,055 million, almost doubling YoY.
4. Net Debt: The company reported a net debt of CHF 173 million as of September 2024.
5. Capex: H1 FY25 capital expenditure reached approximately USD 15.9 million.
Operational Highlights
1. Revenue Mix:
- CRAMS: Major contributor with 84% of total revenue. Sales grew 51.7% YoY, fueled by increased commercial sales.
- NCE APIs & Intermediates: 6.2% share, with a 36.9% increase in revenue due to growth at the Bavla site in India.
- Cholesterol & Vitamin D Analogues: Decline in sales by 35.7% due to lower margin realization in Cholesterol SF.
- Quats & Generics: Decline due to reduced demand in the agrochemical sector.
2. Capacity Utilization: Focused on improving capacity utilization by targeting small to mid-sized global biotech companies and expanding in new geographies.
Strategic Insights
1. Global Presence: Operations span Switzerland, the UK, France, Netherlands, India, and China, with 28 R&D labs and multi-purpose facilities.
2. Oncology Focus: Oncology, a high-growth therapeutic area, is a priority, with several late-phase oncology molecules in the pipeline.
3. HIPO Facility: The Bavla site in India houses Asia's largest high-potency API (HIPO) facility, positioning DCAL well for growth in oncology.
Industry Overview
- Specialty Medicines Growth: Specialty medicines, which include high-potency oncology drugs, are projected to grow significantly, with an expected 43% share in global pharma spending by 2028.
- Oncology Market: Oncology is projected to grow at a CAGR of 14-17% through 2028, driven by new treatments and demand for potent drugs.
Investment Considerations
2. 1. Strong Revenue and Margin Growth: Consistent revenue growth with enhanced EBITDA margins, indicating improved operational efficiency.
2. Global Expansion & Diversification: Expanding into new geographies and targeting small/mid-size biotech clients mitigates risk and enhances revenue stability.
3. Oncology Focus and HIPO Facility: The HIPO capabilities in India align with the high-growth oncology sector, suggesting long-term growth potential in specialty pharma.

consolidaton breakout in DCALwide range bullish candle with volume on 31 July 2024 after that stock consolidated with narrow range candle and constricted volume on, 12 &, 13 Sep inside day candle today 16 Sep 2024 forming wide range bullish candle and breaking out the price congestion good for short term swing trading.

DCALAfter a downtrend rally it start to reverse and form bullish 123 on 29 july then it goest to second stage which is consolidation now these stock trading near about 192 if it close above 201 with more than avergae volumes then it should be bang , please do your analysis then invest .


Buy Dcal for a target of 200Buy Dcal for a target of 200 in 5-10 trading days and target of 260 in 3 months

DCALHi, in this chart i found a Good Demand Level in DCAL,
I Observed these Levels based on price action and Demand & Supply which is My Own Concept Called "PENDAM CONCEPTS" ... Please Don't Take any trades based on this chart/Post...because this chart is for educational purpose only not for Buy or Sell Recommendation.. Thank Q

DCALDCAL : - The stock has given a breakout after 5 years. Keep an eye on the stock.
Hello traders,
As always, simple and neat charts so everyone can understand and not make it too complicated.
rest details mentioned in the chart.
will be posting more such ideas like this. Until that, like share and follow :)
check my other ideas to get to know about all the successful trades based on price action.
Thanks,
Ajay.
keep learning and keep earning.

DCAL Long PositionalDate : 02-03-2024
Buy DCAL above 283
Target of 316, 350, 419, 504, 590
SL 175
Strategy : SBO + RSI > 60 + EMA above 20, 50 & 200
Cup and Handle Pattern in Monthly Time Frame
Duration few weeks to Months
Please consult your financial advisor before investing
All research for educational purposes only.
Stock is ready to cross past barriers with good volumes

#DCAL (Weekly)⚡️Low Debt
⚡️Price/Book value 0.69
⚡️Multiyear Breakout
⚡️5 Years Long Base
⚡Momentum expected above 280
🔴 SL 243
🟡 CMP 255
🟢 TGT 281/319/383
