#DCMSRIRAM nice breakout#DCMSRIRAM nice breakout with volume after year consolidation and cup and handle patteren also
Trade ideas

DCMSHRIRAM - Bullish Consolidation with VolumesNSE: DCMSHRIRAM is closing with a bullish consolidation candle supported with volumes.
Today's volumes and candlestick formation indicates strong demand and stock should move to previous swing highs in the coming days.
The stock has been moving along the horizontal support for the past few days which is indicating demand.
One can look for a 8% to 11% gain on deployed capital in this swing trade.
The view is to be discarded in the event of the stock breaking previous swing low.
#NSEindia #Trading #StockMarketindia #Tradingview #SwingTrade

DCMSHRIRAM - Weekly AnalysisIn the Weekly Chart of DCMSHRIRAM ,
we can see that; it has multiple rejections at 1100 levels.
Also, it has not given closing above 1100, but Price action is strong for big momentum.
Also, 1200-1250 levels is respected multiple, Once it reaches there it might halt for 2-3 weeks.
Expected momentum is shown in chart.

DCM Shriram - Sugar + Caustic SodaAn interesting co which went up and now pivoted...could be due its next move up..
Long above 996 with a SL below 960.
I'd allocate 50% and then double it up above 1120. (At this point keep SL at cost which would be close to 1060)

DCM SHRIRAM | LongGap down >> Gap filled >> Ready for Breakout
Buy = today's close = 909.15
SL on closing basis marked.
Target marked.

Big Fresh Breakout📈 Exciting Bullish Pattern Alert! 🐂
📊 Pattern: Fresh Breakout
📌 Symbol/Asset: DCM SHRIRAM
🔍 Description: Buy on Dips
👉 Remember: Technical patterns are just one piece of the puzzle. Consider conducting further research, consulting with a financial advisor, and managing your risks appropriately.

DCMSHRIRAM- long bullish inside bar is followed by a bullish engulfing pattern
target 1- 950
target 2 -1000

DCMSHRIRAM - Weekly AnalysisIn the Weekly Chart of DCMSHRIRAM ,
we can see that; it is near breakout.
It might respect one last time and then give breakout.
Expected momentum is shown in chart.

A potential of 30% gainYet another chemical stock is breaking out from the pattern.
Study:
Pattern - Inverse Head & Shoulder Breakout
Time Frame - Breakout confirmed on weekly chart
Momentum - Big Green weekly candle.
Volume - Hige volume. More than anything in 1 year.
Potential - New All time high.
Journey Time - 3 months to 1 year.
Note: This is not a recommendation. Kindly do your own analysis before investing.

DCM SHRIRAM - Intraday Trade || 12th June, 2023 #stocks To be traded for Intraday today
12th June, 2023
DCM SHRIRAM
#intraday #stocks #priceaction
Analysis Criteria Used:
1. Please find the Chart Analysis done for the Intraday Trade Idea levels for 12th June, 2023
2. The analysis for the Trade ideas, has been done based on Trend analysis and Chart Patterns with Volume Buildups
Focus On:
1. Always keeping your Risk Management in play
2. Using a Stop Loss; because it is your Best Friend
3. Always Plan your Trade and stick to your Plan
4. Dont overthink or overanalyse
5. Treat this as your Business and get serious about it
#sharemarket #stockmarket #nifty #sensex #investing #trading #nse #bse #stockmarketindia #stocks #indianstockmarket #investment #stockmarketnews #banknifty #finance #money #intraday #intradaytrading #investor #niftyfifty #dalalstreet #sharemarketindia #sharemarketnews #stockmarketinvesting #business #sharemarkettips #stock #india #indiansharemarket #rakeshjhunjhunwala #bhfyp #mumbai #share #wealth #investment #market #invest #trading #investing #finance #FinancialFreedom #investor #trader #stocks #profit #investors #economy #equity #shares #nifty #stockexchange
DISCLAIMER:
.
* Please do your own research and/or contact your financial advisor before taking any trading opportunities
** We will not be responsible for your profit or loss
*** We are NOT SEBI REGISTERED
______________________
best stocks to buy today
best stocks to buy now
best stocks to buy
best stocks for Intraday tomorrow
best stocks for long term investment
best stocks to buy today india
best stocks for swing trading
swing trading strategies
swing trading beginners
what is swing trading
swing trading stocks
swing trading stock selection
swing trading kya hai
nifty analysis
nifty view
bank nifty analysis
top stocks to buy now
strong stocks
nifty view
nifty prediction
stock market view tomorrow
bank nifty Levels
bank nifty prediction
share news
stock market news
best stocks to buy now
profit booking stocks
multibagger stocks in discount
breakout stocks
best short term stocks
best short term shares
next multibagger stocks

DCMSHRIRAMAfter Successful Breakout From Rising channel Pattern
DCMSHRIRAM is forming a Very Beautiful Inverted Bull Flag for further downtrend to reach our Target Zone - 725 to 755 which can be buying opportunity.
Inverted Bull Flag ???
NSE:DCMSHRIRAM

Swing trade in DCM Consolidation is one of the most indicators of good future trend in the future.
so currently DCM is trading in range and consolidating in range for more then 2-3 months
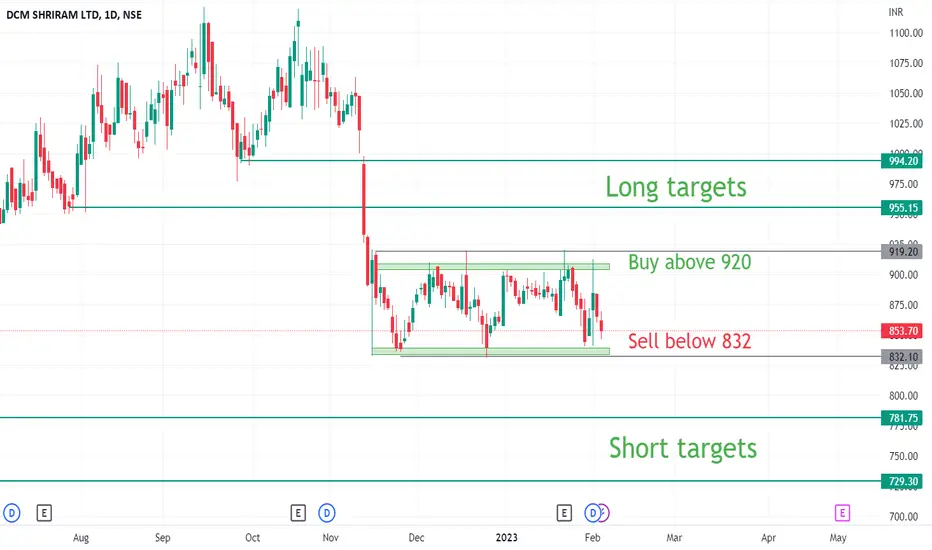
so the plan is simple we can short if it crosses the lower range and long if it breaks the higher range
so good luck for the trade and trade safe and at your own risk
For Long Term investorsPrice went from 180 to 1180 in 16 months and then consolidated between 890-1180 forming a flag pattern. It seems to have breakdown with decent volume. At Least it is a sign of caution for all the long term investors of DCMSHRIRAM that could start to fall. Hence it is time to look at your positions.

a trade in makingrange consolidation with volatility contraction base formation, the missing piece in puzzle is relative outperformance

DCM SHRIRAM RANGE BREAKOUTAlmost 80 days consolation breakout.
Put stoploss breakout candle low (995).
Target alltime high (1241).
Do own work before enter.

DCMSHRIRAM Long (04 Aug)DCMSHRIRAM Long (04 Aug)
RSI- 63
Trading above all moving averages, rising volume
Buy at CMP- 1030
SL- 1000
Target- 1105, 1165
Join us, Learn more, Earn more
Disclaimer- We are not SEBI registered advisor.
Charts and views are only for educational purpose.

Triangle breakout Small triangle breakout at 965. Add more once it closes above 1030. Play on caustic soda, sugar and fertilizers.

Expecting breakout ✌✌✌This scrip is expected to give breakout in the coming days. So traders keep on your radar to catch the momentum. Thanks to all 🙏🙏

bullishshort term
entry :1060
target:1200
13% upside
minor resistance 1100
use 50 ema
might turn bearish due to current market condition

DCM Shriram, products likely to see good marginsMonthly chart of DCM Shriram is painting a rosy picture...price is oscillating for months inside a price band of 855 to 1250...was poised to break out towards the end of April but has been hemmed in by the geo political news sentiment or news of fed tapering, take your pick.. all segments of the company be it sugar, fenesta, agri inputs and chlor alkali could be doing well in the present environment.. Stop loss at 1045 closing basis..T1 1365 T2 1800
Very uncertain environment, be clear in the trades


ShortTerm analysis DCMshriram - #StockMarketIndia #StocksToBuy Possible Trades
- DCM looks bullish On closing above 1216
- Enter at 1216 and look for target of 1330+
-Will hit the target in next few sessions
-Alert - Earnings result to be announced next week
Thanks
- Stock Explorers

#DCMSHRIRAM- Potential BO#DCMSHRIRAM- Potential BO
CMP - 1243
BO Only Above 1260
Next Levels can be expected 1435 & 1700
View will be negated below 903
Disclaimer : We are not Sebi registered analyst or Authorized analyst
The charts / Levels / Price projections are only for educational purpose.
This is our personal view, Pls consult your financial advisor before taking decision - Buy / Sell
We will be not responsible for your profit and Loss
Please like and retweet if you like this idea.
