DEVYANI - TRINGLE BREAKOUTDevyani Intl – Triangle Breakout Loading? 🚀
📊 Stock Analysis: Devyani International Ltd (NSE: DEYANI)
🔹 Technical Overview
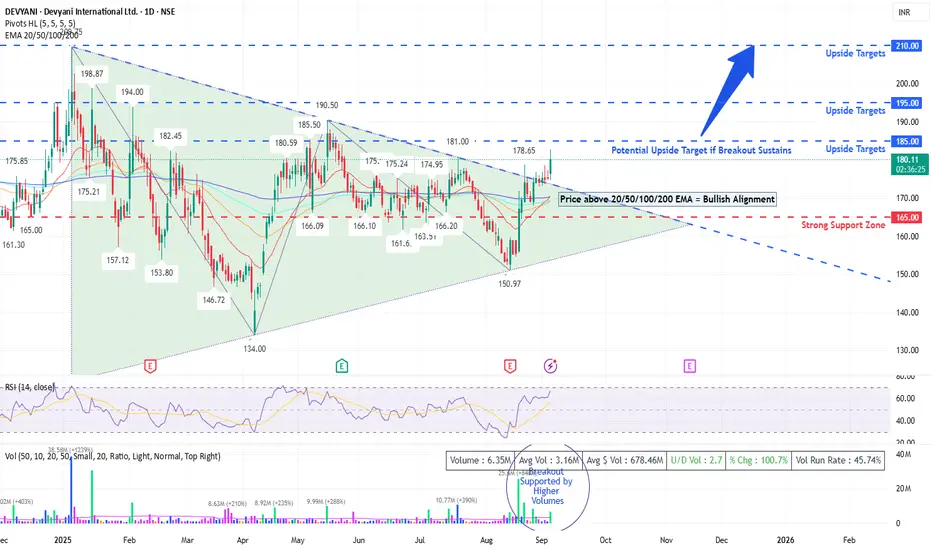
Pattern: Symmetrical Triangle breakout attempt visible on daily charts. Price has tested the upper resistance trendline multiple times (₹190–₹195 zone) and is now trading above short-term EMAs.
Key Support Levels : ₹165, ₹150
Immediate Resistance Levels: ₹185, ₹195 (major breakout zone)
Indicators:
RSI (14): 66.5 → Positive momentum, but near overbought levels.
EMA Cluster (20/50/100/200): Price trading above all key EMAs – strong short-term bullish signal.
Volume: Breakout supported with above-average volumes (5.3M vs 3.1M avg).
➡️ A sustained close above ₹185–₹190 could trigger a rally towards ₹200–₹210.
🔹 Fundamental Snapshot
Business Model: Devyani International Ltd is the largest franchisee of Yum! Brands in India, operating KFC, Pizza Hut, and Costa Coffee.
Growth Drivers:
Rapid store expansions (targeting Tier II/III cities).
Rising QSR demand in India with improving urban disposable income.
Long-term industry tailwinds in organized food retail.
Risks:
Margin pressures due to inflation in raw materials.
Intense competition in QSR space (Domino’s, McDonald’s, Burger King).
High dependence on discretionary consumer spending.
🔹 Trading Strategy
Short-Term (1–3 weeks): Buy on dips near ₹170–₹175, SL below ₹165. Target: ₹190 / ₹200.
Medium-Term (2–3 months): If breakout above ₹195 holds with volume, positional target can be ₹220+.
Risk Management: Keep SL below triangle support (₹160) for positional trades.
🔹 Sentiment & Outlook
📈 With improving consumer demand and strong expansion plans, Devyani remains a long-term growth story in India’s QSR sector. Current technical setup indicates a potential breakout rally if momentum sustains above ₹185–₹190.
⚡ Conclusion:
👉 Stock is at a make-or-break zone. Sustained move above ₹190 could unlock fresh highs, while failure may keep it in consolidation within the triangle.
DEVYANI trade ideas
DEVYANI – Breakout Retest Completed | Short-Term Rally BrewingDEVYANI – Breakout Retest Completed | Short-Term Rally Brewing
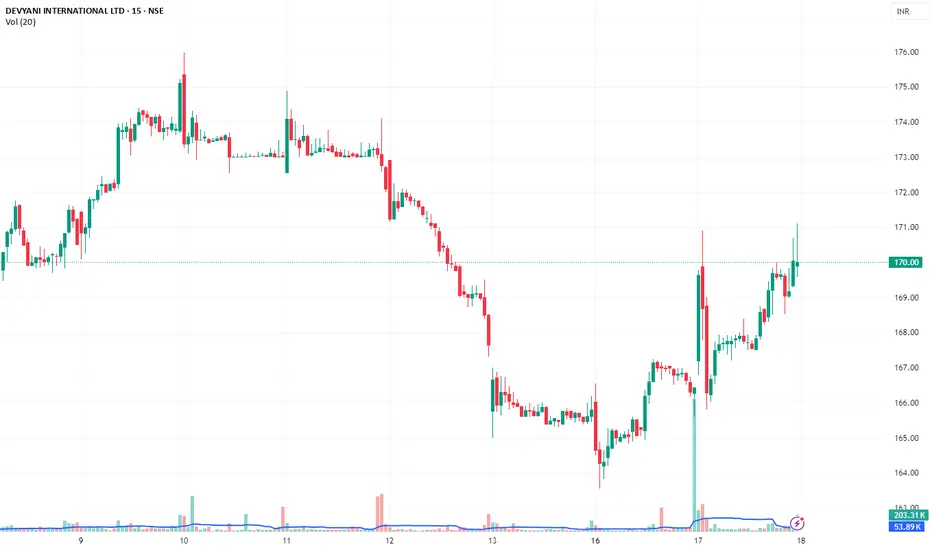
🟢 CMP: ₹170.15
📆 Date: 17 June 2025
📊 Timeframe: 2–4 Days Swing Trade
🔍 Technical Analysis
✅ DEVYANI broke above the key level of ₹169.20 with conviction
✅ Post breakout, the stock consolidated in a tight range – a classic bullish continuation setup
✅ Price structure is forming higher lows, suggesting accumulation
✅ Strong wick rejection seen near ₹165 on June 17, confirming buyers stepping in at dips
✅ Volume noticeably rising in the last hour of trade, with price heading higher
✅ Final candle of the session closed just below the intraday high, hinting potential upside continuation
🎯 Trade Plan
🔹 Parameter 🔹 Value
Buy Zone ₹169 – ₹171
Stop Loss ₹166.40 (below swing low)
Target 1 ₹174
Target 2 ₹177.50
Target 3 ₹181
Risk–Reward ~1:2.4
🔥 Conviction Score: 80%
💡 Clean structure + minor breakout + volume rise = Short-term bullish bias
⚠️ What to Watch For
Volumes should continue above 45K per 5-min candle
Immediate resistance: ₹172
Closing above ₹171.20 can fast-track the momentum move
#DEVYANI #BreakoutSetup #VolumeConfirmation #SwingTrade #NSEStocks #BullishBias #MomentumMove #SmartMoneyFlow
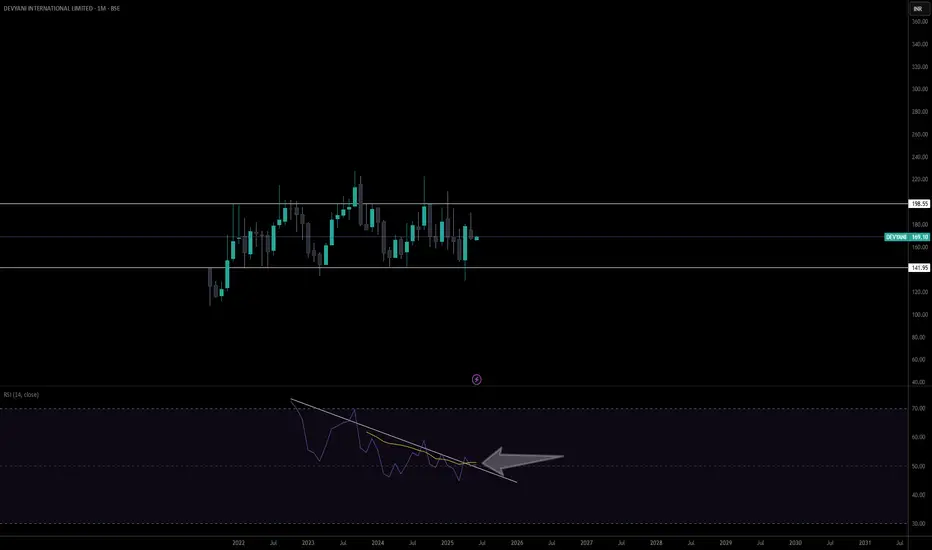
Devyani looking Bullish from herePrice has been in sideways since the begining. Monthly RSI broke out and re-testing, looks like it's time to come out of the range. Bullish for June. Not a Financial Advise.
devyani international ltd.Let's conduct a **technical analysis** of **Devyani International Ltd.** (Devyani), which is one of the largest franchisees of Yum! Brands in India, operating popular brands like Pizza Hut, KFC, and Taco Bell.
---
### **Technical Analysis of Devyani International Ltd.**
#### **1. Support and Resistance Levels**
- **Support Levels:**
- Support levels are where the stock has previously found a floor or a reversal point.
- **Example Support Levels:** If Devyani has bounced at ₹175, ₹180, or ₹185 in recent times, these levels are key areas to monitor.
- A drop below these levels could signal a bearish trend or a deeper correction.
- **Resistance Levels:**
- Resistance is where the stock faces selling pressure and struggles to move higher.
- **Example Resistance Levels:** Levels such as ₹210, ₹220, or ₹230 could be strong resistance levels for the stock.
- A breakout above these levels could indicate further bullish momentum.
#### **2. Moving Averages (MA)**
- **50-day Moving Average (MA):**
- The 50-day MA is a short-term trend indicator. If the stock is trading above the 50-day MA, it indicates short-term bullishness.
- **Example:** If Devyani is trading at ₹200 and the 50-day MA is ₹190, it suggests short-term upward momentum.
- **200-day Moving Average (MA):**
- The 200-day MA represents the long-term trend. If the stock is above the 200-day MA, it suggests a long-term bullish trend.
- **Example:** If the stock is at ₹200 and the 200-day MA is ₹180, it signals the stock is in a long-term bullish phase.
#### **3. RSI (Relative Strength Index)**
- **RSI Levels:**
- **Above 70:** This suggests the stock may be overbought, indicating that a pullback or consolidation might occur.
- **Below 30:** This suggests the stock may be oversold, potentially indicating a buying opportunity.
- **Current Example:**
- If the RSI is **above 70**, it suggests that Devyani may be overbought, which could result in a pullback or correction.
- If the RSI is **below 30**, it may indicate that the stock is oversold, and it could reverse or bounce back.
#### **4. MACD (Moving Average Convergence Divergence)**
- **Bullish Signal:** A bullish signal occurs when the MACD line crosses above the signal line, suggesting potential upward momentum.
- **Bearish Signal:** A bearish signal occurs when the MACD line crosses below the signal line, indicating a potential downward movement.
- **Current Example:**
- If the MACD line is **above the signal line**, it suggests bullish momentum for Devyani.
- If the MACD line is **below the signal line**, it suggests bearish pressure and potential downward movement.
#### **5. Volume Analysis**
- **Increasing Volume:** If the stock is moving upwards with increasing volume, this confirms strong buying interest and a healthy trend.
- **Decreasing Volume:** If the price is moving up or down with decreasing volume, it indicates a lack of conviction behind the move.
- **Current Example:**
- If Devyani is rising with increasing volume, it indicates that the buying interest is strong and supports the bullish trend.
- If the stock rises with decreasing volume, it might indicate weakening momentum or a possible reversal.
#### **6. Candlestick Patterns**
- **Bullish Patterns:**
- Patterns like **Bullish Engulfing**, **Morning Star**, or **Hammer** near support levels signal a potential upward reversal.
- **Bearish Patterns:**
- Patterns like **Shooting Star**, **Bearish Engulfing**, or **Evening Star** near resistance levels signal a potential downward reversal.
- **Current Example:**
- A **Bullish Engulfing** pattern near ₹190 could indicate a potential reversal to the upside.
- A **Shooting Star** pattern near ₹220 could indicate a potential reversal to the downside.
#### **7. Fibonacci Retracement Levels**
- **Fibonacci Levels** help identify potential support and resistance during a pullback. The key levels are **23.6%, 38.2%, 50%, 61.8%**.
- **Current Example:**
- If Devyani has moved from ₹180 to ₹220, you can check the Fibonacci retracement levels for support during a pullback:
- **23.6% retracement** around ₹210
- **38.2% retracement** around ₹200
- **50% retracement** around ₹190
- **61.8% retracement** around ₹180
These Fibonacci levels can serve as potential support levels if the stock faces a price correction.
---
**Disclaimer:**
- I am not a SEBI-registered professional or licensed financial advisor.
- This analysis is based on historical price data, technical indicators, and general market trends.
- Any decisions you make based on this information are entirely at your own risk. Please consult a licensed financial advisor before making any investment decisions.
- Technical analysis cannot guarantee future results, and stock prices can be influenced by numerous factors, including news, economic data, and other market developments.

Momemtum Trade in Devyani InternationalA Short Momentum Trade in Devayani International is active now.
On 2hr TF it has given break out of C&H pattern and trade details can be found in Chart.

Bullish idea on Devyani The stock is consolidating in a range for almost 3 years. and now trying to break the range. If this happens, the first target will be 223 and second target will be 264.

Devyani - The time is changing."Hi everyone, VCP Trader is back with an exciting investment opportunity!
Stock in Focus: Devyani International
This stock has been forming a strong base for over 3 years, creating a range of 100 points. Such prolonged consolidations often lead to explosive moves, and this setup looks like a textbook example of the Volatility Contraction Pattern (VCP).
What's Happening Inside the Base?
When we break down the structure of this base:
Clear Contraction: The stock is contracting from left to right, as evident by the tightening price ranges.
Three Distinct Legs:
The 1st leg shows a significant drop with high volatility.
The 2nd leg has reduced volatility and volume, signaling less aggressive selling.
The 3rd leg is even tighter, indicating supply drying up.
Volume Analysis: As expected in a VCP, volume has been steadily declining with each contraction, confirming institutional accumulation.
Point of Polarity
The critical point of polarity lies at 140, which is the make-or-break level for this setup.
A strong bounce from here could trigger the long-anticipated breakout.
Risk management tip: If the stock gives two consecutive weekly closes below 140, it would invalidate the bullish setup, and we would change our bias.
Target Projection
Using the base measurement of 100 points, we can anticipate an up move of 50-60%, projecting a target of 300 or more. This aligns perfectly with the price-action dynamics of similar VCP setups in the past.
Why Does This Matter?
Prolonged Accumulation: A base of this length (3 years) builds a significant cause (institutional positioning), which often results in an equally significant effect (large price movement).
2025 Breakout Potential: Such setups rarely fail when the structure is intact, making 2025 a pivotal year for Devyani International.
Low-Risk, High-Reward Opportunity: Entering near the breakout point or close to 140 offers an excellent risk-to-reward ratio.
Final Thoughts
This is a perfect VCP setup for traders and investors alike. With a well-defined range, clear contraction, and a breakout projection, this stock is on the verge of a significant move.
Stay disciplined and stick to the plan:
Entry: Near the breakout above the top of the base.
Stop Loss: Below 140 (point of polarity).
Target: Above 300 in 2025.
Keep this on your radar—it’s shaping up to be a potential game-changer! 🚀
#VCP #StockAnalysis #DevyaniInternational #Breakout #InvestmentOpportunity #TechnicalAnalysis

DEVYANI#DEVYANI
Observations:
Forming Higher Highs (HH) and Higher Lows (HL) on the weekly chart, indicating a potential uptrend.
Last week's big move was accompanied by above-average volume, suggesting strong buying interest.
Relative strength against Nifty has improved.
Caution:
The stock has been trading in a range for several years, which may indicate a lack of clear direction.

DEVYANI INTERNATIONAL DESCENDING TRIANGLE BREAKOUTDevyani international descending triangle brakout
with volume spike,rsi bullish
breaking 200 ema
above 183 #target 222
sl 167
no buy/sell recomendation

Stock in consolidation zone: Devyani InternationalDevyani International has been trading in a box pattern since Oct 2024.
It has strong support around 161 levels.
Currently it is in strong consolidation around 172 levels.
Current market turmoil has negligible impact on the stock price.
However, a volume spurt has to happen for significant momentum toward upside levels.
Resistance levels: 180, 194, 223,

Turning Bullish: Devyani International Ltd.Devyani International Ltd. has been in consolidation for more than two months.
A couple of days ago, it gave a positive breakout with good volume.
The downside risk is limited, and the upside potential is huge.
20 EMA (Black Line) is trading just below 50 EMA (Orange Line) and 100 EMA line (Sky Blue line).
In the weekly closing, if the 20 EMA crosses above 50 EMA and 50 EMA crosses above 100 EMA we can confirm the bullish trend and take long positions.
Resistance levels: 180, 194, 223
Support levels: 161, 145

Turining Bullish: Devyani InternationalDevyani International has broken the BoX pattern.
The stock has shown Strong Momentum: Price above short, medium, and long term moving averages
It has demonstrated good quarterly growth in recent results
Brokers have revised the target recently.
Companies with rising net profit margins - quarterly as well as TTM basis

Devyani International: Will Weekly Momentum Fuel a Breakout?Devyani International is currently making higher lows, as indicated by the trend line. The stock has established strong support at 142, with resistance at 203. After two failed breakout attempts, the question remains: will the third succeed or will it pull back to support?
Minor resistance at 179 has now turned into support. However, it is important to note that while the weekly volumes remain unimpressive, the MACD is showing growing strength, signaling potential bullish momentum in the coming weeks.
Potential Risk:
The primary risk to the stock's upward trajectory is the possibility of a broader market correction, particularly influenced by uncertainty in the Index.
Disclaimer:
This analysis is intended for educational purposes and is not a recommendation to buy. It is important to learn how to recognize and understand patterns in stock movements.

Devyani International Ltd. (DIL) Analysis: A Techno FundaFundamental Analysis:
Devyani International Ltd. (DIL) is a leading player in the Indian food and beverage sector, operating well-known franchise brands such as Pizza Hut, KFC, and Costa Coffee.
1. Business Overview:
DIL holds a strong portfolio with global QSR (Quick Service Restaurants) brands, leveraging its vast network across India and several international markets. Its franchise agreements provide the company access to world-class products and marketing strategies. This strategic positioning gives it a competitive edge in the growing QSR market.
2. Financial Performance:
Revenue Growth: The company has shown consistent revenue growth over the past few years, driven by strong demand in the QSR space. FY23 reported solid sales, attributed to increased consumer spending post-pandemic and aggressive expansion strategies.
Profitability: Operating margins have been improving, mainly due to cost optimizations and increasing average order values across delivery and dine-in.
Debt Levels: DIL's debt has been manageable. The company focuses on reducing its debt-to-equity ratio, improving long-term financial health.
Expansion Plans: The aggressive store addition strategy in both metro and tier-2/3 cities has expanded their market share, with over 1,200 stores across 27 states. Such growth potential is attractive for long-term investors.
3. Valuation:
PE Ratio: The stock currently trades at a price-to-earnings (PE) ratio higher than the industry average, indicating investor confidence but also a need to deliver robust earnings in the future to justify its valuation.
Earnings Per Share (EPS): EPS growth is promising, with strong potential for future earnings as the Indian QSR market expands.
4. Key Risks:
Competition: Intense competition from domestic and international players could pressure margins.
Inflation and Supply Chain Costs: Rising raw material prices could impact profitability.
Franchise Risks: Dependence on franchising contracts for top brands makes it vulnerable to changes in agreement terms.
Technical Analysis:
1. Price Trends:
Long-Term Trend: The stock has been in an uptrend since its IPO, reflecting investor optimism.
Moving Averages: The stock is trading above its 50-day and 200-day simple moving averages (SMA), indicating bullish momentum. Short-term pullbacks have been absorbed quickly by the market, suggesting strong support levels.
2. Support and Resistance Levels:
Support: A key support level is found near ₹160, where the stock has historically bounced back.
Resistance: A major resistance level is around ₹230, where the stock has faced selling pressure.
3. Indicators:
Relative Strength Index (RSI): The RSI currently hovers around 60-65, signaling that the stock is not overbought but has some room for further upside.
MACD (Moving Average Convergence Divergence): The MACD line is above the signal line, further confirming the ongoing bullish momentum.
Volume: The stock has shown increasing trading volume during upward moves, signaling strength in the trend.
Conclusion:
Devyani International Ltd. has strong fundamentals, backed by an aggressive expansion plan, solid revenue growth, and improving margins. Technically, the stock is in a bullish phase, but traders should watch for pullbacks near key resistance levels. For long-term investors, the stock's potential growth in the Indian QSR market makes it an attractive buy, but cautious monitoring of valuation and competition risks is essential.
Disclaimer: This analysis is for educational purposes only. Always consult with a financial advisor before making any investment decisions.

Dewayani International Stock is chasing weekly resistance 230 . If brake , it will go 250 ++ , 270. Supported by good volume.
If brake out fails it will take support at 180 - 185.
Analysis is only for learning purposes. No buy sell recommendation.

Devyani -Resistance BreakoutDevyani :
Resistance Breakout done, currently at resistance levels
Need to sustain 227 levels

Devyani Int Short Term TradeThe stock has been in an overall long term trend
Lately overall volume is indicating strong bullish sentiment
A rising wedge pattern has been formed
Also level around 199.4 has been an strong resistance zone (pink horizontal line)
Breakout has occured through the pattern as well the resistance
vol and atr has also shown a sharp surge on breakout
Thus, for a short term trade,
tgt 215.5 , sl 198

DEVYANI DAILY CHART ANALYSISDEVYANI CMP@196
Chart Pattern Looks Bullish
Above All Major Averages
Above Monthly CPR
RSI Bullish
RS Bullish
5X Volume Today
Headed Towards 225

Devyani International (W Bullish Pattern)Date : 10th April 2024
Time :12.00 PM
Devayani International is showing reversal from its usual support with other bullish indications.
As we can see ,
first of all W pattern is visible from strong support. also there is a bullish Divergence too.
Wave Count on Devyani is also looks like its time for ABC wave till depth of correction price level, which is 198 Rs.
Order Blocks on multiple time frame is also visible after last bullish movement.
With A Stop Loss of 150 Rs. [ i] We can Long Devyani Int.
Entry Zone will be 162 to 155 Rs with Target of 198 Rs
and RR is Minimum 1:3

Devyani International Potential Bullish MomentumFollowing a notable consolidation phase that commenced in January 2024, Devyani International has exhibited promising technical signals, suggesting a potential shift towards a bullish trend. Last week, the stock successfully breached the pivotal resistance level of 185 on the weekly timeframe, which is a critical psychological and technical milestone.
The 20 EMA has crossed above the 50 EMA on the weekly chart, a classic indicator of bullish momentum known as a "Golden Cross." This crossover typically signals a potential uptrend and aligns with the stock's recent move above the 185 pivot point.
Both the daily and weekly RSI readings have indicated bullish momentum, suggesting the stock has been gaining strength relative to its price action over the observed periods. The MACD indicator on both daily and weekly charts is also reflecting bullish dynamics, with the MACD line crossing above the signal line.
The stock has managed to close above the equilibrium level, a point where buying and selling pressures are balanced, on both the daily and weekly charts. A sustained close above this level could signify strong sentiment among investors, further corroborating the potential for upward momentum.
A Change of Character has been observed on the weekly chart, indicating a shift from prior selling exhaustion to potential buying interest. This technical pattern often precedes substantial price movements, and in this case, it may suggest that sellers are losing control, paving the way for bulls to take the lead.
Given the aforementioned technical indicators and patterns, the next resistance level is identified at approximately 236. Should the stock continue its bullish trajectory, this represents a potential upside of around 25% in the short term. Traders should closely monitor volume trends and broader market sentiment to fortify their positions.
Disclaimer: The information provided in this stock analysis is for informational and educational purposes only and should not be construed as financial advice. Always seek the advice of a qualified financial advisor or conduct your own research before making any investment decisions.

Devyani INT Swing Long Setup - Devyani Int is currently trading at 183
- Devyani has the perfect compression setup look expand towards the upside
- Before initiating swings wait for it to retrace back to 177-179 that's a very good area to look for longs and add more and more size
-Invalidation below 171

Devyanithis chart is looking very much ready for an upside for long sideways timepass, only for education purpose

Devyanithis chart is looking very much ready for an upside for long sideways timepass, only for education purpose
