Respecting Very Good Support Zone If support breakeven then u can short OR If respect the support zone then any stong candle then We Go for LONG slide
Trade ideas

Divislab available at good support price, 3-5% quick gainsIn Monday's probable gap down, Divis lab should be available at good weekly support price of 3370-3463 price range. If anyone able to enter in this price range then targets 1) 3676 2) 3797. Weekly hammer candle also seen, keep eyes open for quick scalping of 3-5% gains.

DIVIS Labratories - Break Divi's Laboratories Limited is an Indian multinational Pharmaceuticals company and producer of active pharmaceutical ingredients and intermediates headquartered in Hyderabad, Telangana, India. The company manufactures and custom synthesizes generic APIs, intermediates

Divis Lab - reversal Trade - Target 3750 & 4450Divis Lab - Reversal Trade - Target 3750 & 4450
Showing signs of reversal. 12 days of consolidation then break out
Weekly Doji at support bottom (Sept 2020 levels) followed by Marubuzu this week confirming reversal.
RSI showing strength on daily chart with upward momentum as well as MACD weekly cross over.
Good RR. With 5% as SL one can target 33%.
Also this recommendation/presentation and all future ones are & will be only for learning purpose.
Please consult your financial advisor before investing.
Thank you.

Divis Lab - Engulfing Bullish patternFew days of consolidation with Engulfing Bullish pattern observed in Divis Labs. For short term it could be a good buy opportunity.

Divid lab breakout on hourlyDivis lab has given consolidation breakout on hourly chart and has bounsed from monthly

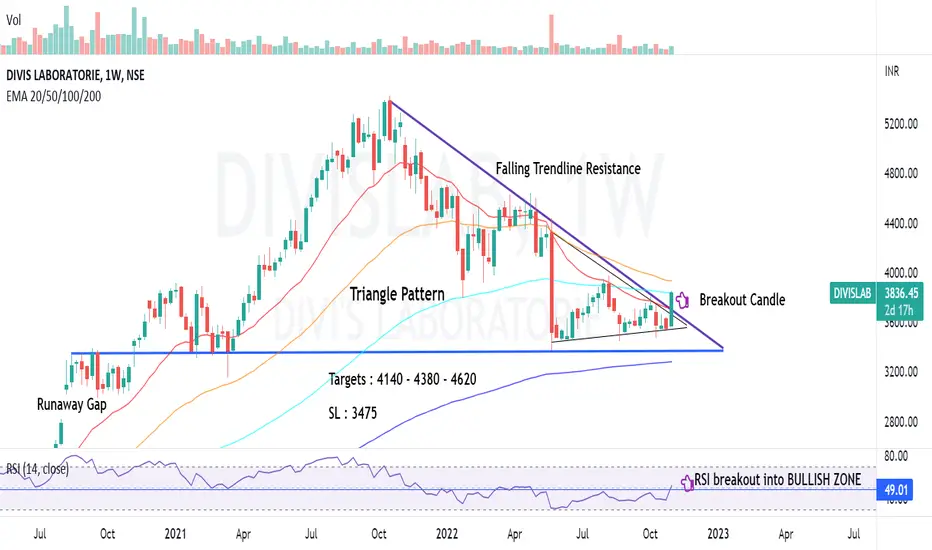
DIVIS LAB | Triangle Pattern BO with Vol | 20%NSE:DIVISLAB
Breakout with volume from Triangle Pattern
Targets : 4140 - 4380 - 4620
Upside : 20%
SL : 3475
Time Frame : 3-6 Months
RSI Back in Bullish Zone
CMP above 20 & 200 Week EMA
Divis Lab on the making of Head & Shoulders-weekly. Watch out!!!Please keep an eye on the H&S pattern forming in Divis. If the right shoulder is fully formed in weekly and if it closes below the neckline, it can be a good short opportunity
Divis shortcmp 3271
support broken at 3357 on weekly chart
Next support 3025
stock in in downward trend


Divis LabHead and shoulder pattern in Divis Lab suggest more deeper levels.
Start adding for long term near 3200/3000 50% amount anda rest 50% near 2800 level if comes.

DIVISLAB Channel formed |Head & shoulder |Time to "decide trend"
• As shown on chart DIVISLAB shows channel formation . Current red candle is showing respect to the channel's resistance trendline.
• Historical Support is there from 3350.10 to 3435.00 shown on chart. •Above 3981.90 Trend can be change with the formation of Higher High's (HH) and /Higher Low's (HL) .
• Chanel deciding the price.
• Head and shoulder Pattern : Let decide the trend as we can see head and shoulder on bigger timeframe, therefore , 3981.90 We can consider it as a Flip level , otherwise downside fall can increase.
• History can repeat : choose the trend.

DIVISLAB forming a beautiful price action patternDIVIS LAB has formed a descending triangle pattern with significant price action setups.
1. We can spot a supply zone that has been marked on the chart, a good amount of shares were exchanged at that price before the prices came falling down.
2. The price then took support from the demand zone as marked and made a new swing high which gave a breakout but with low volumes which ultimately failed and again prices dived deep down.
3. The last major fall was initiated by a bearish engulfing pattern indicating that sellers are now active at that range and GTT orders might be in place there so that region is very important for us.
Now, if the prices break down from the supply zone we can see another sharp fall or if it takes support we can easily see a rally upwards toward the 3800 zone.


Divis Lab possibility of going bearish for short term.As you can see Divis Lab is on the way to downside, in minor Wave E forming a Triangle pattern.
As per EWT minutte wave (c) can travel till fibo ratio 1 or 1.2 which are also my target.
But a trader must be cautious if it breaks the invalid level of 3710, if this level breaks above all study/ Analysis will be invalid.

Divis Lab Buy @ CMP 3737 Target 3800-3850-3900+ SL below 3630Divis Lab Buy @ CMP 3737 Target 3800-3850-3900+
SL below 3630

DIVISLAB chart#DIVISLAB
Time frame- Daily
* Long in PHARMA
* Facing resistance of 50DMA if it crosses it, good upmove can be expected
* Breakout above 3715
* Short term pick
Disclaimer:- I am not SEBI registered analyst. Only for information and education purpose. Please consult your adviser before investing.
#technicalanalysis #technicalanalyst #swingtrading #swingtrader #fundamentalanalysis #bullish #chartoftheweek #trading #tradingstrategy #stockmarket #stockmarketindia #stocks #stockmarketnews #stockstowatch #stockstobuy #stockoptions #longterminvestment #investment #investmentopportunities
#derivatives #derivativestrading #index #indexinvesting #optiontrading #chartanalysis #trader #tradingsignals #tradingview #education #breakout #pattern #information #investing #consolidation #consult #supporting #long #triangle #volume #PHARMA #DIVISLAB

Reversal from Strong support zone in Divis labReversal is showing at very strong support level . in the current market condition, diagnostic sector showing good strength . divis level is one of them.
initial confirmation shown on my indicator and price action is also supporting .
initial immediate target can be 3900.
Always follow risk to reward ratio, this is the only method for survival in the market.
view is educational not any type of recommendation.

Double top pattern in DIVISLB.Discription:
Stock Name:
Chart Pattern: Double top pattern
Time Frame: 1 Hour
Entry: Reversal From resistance level
Targets: Reversal Target up to support level
