DIVISLAB Rectangle Pattern BreakoutThe Analysis Shown is of DIVI S LAB SIDEWAYS RECTANGLE PATTERN BREAKOUT.
Trade ideas


Trading @ Support ZoneDivis Lab is trading near its support zone and can bounce back from this level if it sustains.
Based on the breakout or breakdown at this zone, you can initiate your long or short position.
Disclaimer: This is meant for educational purposes only.
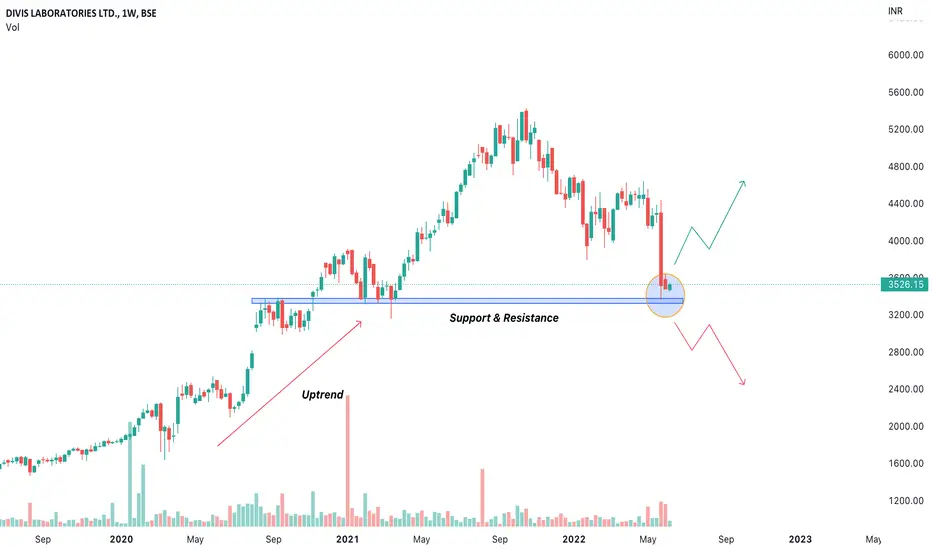
Divis LabLevels are mentioned on the charts.
Only for learning and sharing purposes.
Not a piece of trading advice.

DIVISLAB around a good support area.Technical- Divislab has fallen till is its very imp level of support. It is Halting there. A positional trade can be initiated once reversal is confirmed. 10 to 15 percent can be stoploss downside.
Please look at below fundamentaLs. They are really good. BUT WAIT FOR REVERSAL CONFIRMATION.
Fundamentals-
1. Compounded Sales Growth
10 Years: 17%
5 Years: 17%
3 Years: 22%
TTM: 29%
2. Compounded Profit Growth
10 Years: 19%
5 Years: 23%
3 Years: 30%
TTM: 49%
3. Stock Price CAGR
10 Years: 22%
5 Years: 40%
3 Years: 31%
1 Year: -19%
4. Return on Equity
10 Years: 24%
5 Years: 22%
3 Years: 24%
Last Year: 28%

Divis testing weekly supportDivis lab is testing weekly support again. If broken then can fall till gap level as mentioned in chart. Gap can act as a support or it can get filled if weakness continues. Second scenario can be potential buying at weekly support for upward reversal move. Keep on radar for both possibilities. Pattern and levels mentioned in chart. Follow strict risk management.

Divis labs long at 4590Tranche 1 of 7 shares @ 4590
1. Market is in what stage - Identified by what kind of highs and lows that are being formed + movement of price w.r.t 21, 50 and 200 EMA
Price topped out in Aug 2021 end, then distribution till Oct, Decline till Dec end and Accumulation from Jan. Currently price bouncing from 200 Daily EMA
Also Price higher than 200 EMA (daily), higher than 21 EMA (Daily), lower than 50 EMA (Daily). Price crossing over 50 EMA daily would signal trend change confirmation
2. Is there any trend reversal in play?
1. Multiple divergence confirmations on MACD , RSI and MFI? Yes
2. At important support or resistance - horizontal - Yes bounce from 4400 zone
3. At important confluence of EMAs + price + support - Yes - Daily 200 and Weekly 50
3. How are the candlesticks behaving and what is the volume doing
Candlesticks - No clear play as of now
4. Is there any trend continuation in play?
Currently in accumulation.... Good candidate for up trend to start
5. Is there any pullback or breakout in play with volume confirmation from a strong horizontal level (support or resistance)
No, not yet.
6. Fundamental factors in play
1. EPS growing quarterly and yearly due to revenue growth and OPM growth (very healthy growth)... PE is lowest compared to EPS growth since Dec 2020
2. Are institutional investors/promotors increasing their stake - Slight decrease in FII and retail holdings which was lapped up by DII

Very basic but pretty effective pattern - 'W' patternWe can easily see the chart of DIVISLAB forming the 'W' pattern. We can buy when there will be one green candle on the support of rectangular box.
How to buy the stock?
Buy above the high of the candle and put the stoploss below the low of the candle.
Target of this trade will be 1:3.

DIVISLAB_BULLISH_BATBuy Above : 4630
Tg : 5238
CBSL : 4330
This is not an investment advice and also please note this is only for education purpose.
So before investing any single rupee, please do your own research according to your risk taking capacity and after that do invest and book profits on right time.

Weekly log scale . Depth of corrective waves (1) Wave (iii) is a wave with a 1st wave extension . It has corrected by wave iv till 38.2% . Wave iv has corrected to wave ii of one lesser degree as per Elliott guide line regarding depth of corrective waves .
(2)See the alteration between wave (ii) - Flat and wave (iv) - Zig Zag .
Long with with SL of 3450 as today a close above 3519 will complete a bullish reversal three inside up pattern


THE GIANT IS BEATEN UP BRUTALLY Divis one the major pharma giant of nifty 50 index, beaten up with so much brutally
next support is looking far below from here
whatsoever way it is being beaten it seems soon will reach there
Please like and follow
regards

Divis Lab Breakdown awaitedStock was down after poor management con call
No proper plans and guidance for future aspirations
Bearish pattern formation on daily chart
If didn't sustain 3800 than might 3200 - 3000 than gap is also unfilled present

DIVISLAB - 23rd MAY 2022Stock Entering Support Area 3920-3300
Expect Choppy Volatile Moves in this Region

Divis Lab shortDetails are given in the chart. After trading in a range, share broke down of the range today.
Rationale
1) Axis MF news
2) Breakdown of range
3) Volume supported.

Divis Lab Analysis !! Broke Out📈 Divis Lab 📉
This broke out from a Resistance Zone of downtrending Trendline and closed above previous high of 4450.
On Buy Side I am looking for Targets of 4680, 4940 and 5370.
StopLoss should be kept below 4200-4300zone.
It offers 1:3 Risk To Reward.
All Important Supports and Resistances are drawn in chart. All levels are on closing basis.
Please have a look and revert back if you need some more study on it.
Disclaimer : Consult Your Financial Advisor Before Taking Any Decision On This Analysis.

DIVISLAB LongLooks good for a move up , levels plotted on chart
Disclaimer:
The content of the idea and the interpretation of data are solely my personal views which being said I do not warrant its completeness or accuracy.
This idea published is purely intended for educational and informative purposes, I urge traders to make their own trading decisions based on their specific trading objectives and financial position

range breakdown with engulf candlerange breakdown with engulf candle is a bearish sign .
NSE:DIVISLAB may come to previous support zone.
sellers-
short entry at 4425-35 ,
target =previous support 3900,
SL 0.6 of bearish engulf candle
buyers- we should enter at previous support 3900-3930 to take small target of 8-10% by putting SL below zone.
Happy trading

DIVISLAB - 50 EMA crossing 200 EMA from belowDIVISLAB - 50 EMA crossing 200 EMA from below in daily TF. It is currently consolidating b/w the range of 4377 and 4579. If it breaks out and closes above 4579 in daily time frame, we can go long. TP will be 4687. It can be a good short time swing trade. Target can be achieved in just few days.
DIVISLAB - Daily TF
Entry Above : 4580
SL : Below of the BO candle
TP : 4687
TP for long term : 5017
N.B. : Sharing my own view. For educational purpose only. You are welcome to correct me if you see any mistake in my analysis.

DivisLabDivisLab CMP 4505
If price doesnt close above the black line,
I am expecting price to move in the channel...
Blue line as my possible tgts
Chart is for study purpose only!!!


Divis lab - Consolidation patternDivis lab: perfectly consolidating from last one and half month within range of4390 4560. A breakout above can help sustain a longer move.

Divis Lab chart structureDivis Lab has been consolidating for a while and has now again formed a mini trading range within a larger trading range just below the resistance. Immediate price action is hinting at breakout. from the range.
