Trade ideas

Double Bottom Reversal - Keep AccumulatingDon't Miss at these levels
for targets of 5500-6000
Positional as well as Investment Pick

Bearish ABCD Pattern Completed in Divislab.Bearish ABCD Pattern Completed in Divislab..... Look for short below 'C' 4310 for a target of 4000 price level up to 'B'.

Divis Lab - Short OpportunityShort Opportunity -
Divis Lab has formed a double bottom on a 1-hour chart timeframe and it is in retracing mode, so it is expected that this stock will fall down on the next trading day till Rs. 4267.90. We will go for short if any candle closes below 4372.75.

Divis Lab - SidewaysSideways
Divis Lab is on the uptrend, but it is having a holt on Rs. 4400, which is the psychological number. When the stock trades at this psychological number it means that the stock might take a holt over there and then may show breakout. If it crosses the critical level of Rs. 4404 then it will show an upward direction again. We can go for long if it crosses this level. But This stock shows both upward and downward trends so there are high chances that it will go sideways.

[ INTRADAY ] DIVISLAB LONG BET
risk: Reward ratio is 1: 2
Rest as per Charts
********
Note -
One of the best forms of Price Action is to not try to predict at all. Instead of that, ACT on the price. So, this chart tells “where” to act in “what direction. Unless it triggers, like, let’s say the candle doesn’t break the level which says “Buy/Sell if it breaks”, You should not buy/sell at all.
=======
I use shorthands for my trades.
“Positional” - means You can carry these positions and I do not see sharp volatility ahead.
“Intraday” -means You must close this position at any cost by the end of the day.
=======
Always follow a stop loss.
In the case of Intraday trades, it is mostly the “Low/High of the Candle”.
In the case of Positional trades, it is mostly the previous swings
********

Divis Lab - Long OpportunityLong Opportunity -
Divis lab ha retraced on last trading day, and it has collected strength to go up. There is critical resistance of Rs. 4352.80, if this stock cracks this level we can go for long or else if this stock falls down we can find buy opportunity at the level of Rs. 4304.45, it can take support of this level and may jump to achieve the target of Rs. 4443.75.
Happy Trading!


Divis Lab - Long OpportunityLong Opportunity-
Divis Lan is in an uptrend and on Friday it can show bullish movement. There is Resistance Zone between 4331.10 to 4334.10, Price has given multiple attempts to break this level, but didn't sustain over there. If it crosses this level then we can go for Long for the target of Rs. 4380.70.
But kindly note that we can't ignore the double top pattern of this stock if it retests at a level of Rs. 4296.40 then we can go for short for the target of Rs. 4241.

DIVISLAB LongLooks good for a move up , levels plotted on chart
Disclaimer:
The content of the idea and the interpretation of data are solely my personal views which being said I do not warrant its completeness or accuracy.
This idea published is purely intended for educational and informative purposes, I urge traders to make their own trading decisions based on their specific trading objectives and financial position

Divis Lab - Long OpportunityLong Opportunity -
Divis lab has confirmed the change in trend. The uptrend has started, The stock gives multiple attempts at a level of Rs. 4235, which is the Fib level of 0.382 but it has not broken this level. The support is strong and it is ready to take the jump. Very soon we can expect a level of Rs. 4461.50.
We can go for a long on Thursday, there are two targets are expected but as the international market closes in positive sentiment, it might open gap up. If it happens we can go for long for 2nd target.

Divis Lab - Long OpportunityLong Opportunity -
Divis Lab has changed the trend from the downward to upward direction. It has been retested at the neckline of Rs. 4066.00 & take a bounce from it. So, there is a bullish trend expected in this stock on Wednesday. It may consolidate at a level of Rs. 4174.55 & then may take a jump or it will retest at a level of Rs. 4116.50 & then may jump. We can plan for the long opportunity for the target of Rs. 4268.60.

Divis Lab - Short OpportunityShort Opportunity -
Divis lab took strong support of Rs. 4013.10. The international market closes in negative sentiments, so it is expected that this stock will open a gap-down. We will initiate our short selling of this stock closes below the level of Rs. 4013.10.
But we can't ignore that there is a double top pattern formed in this stock. and if his stock opens in positive sentiments, we will wait to retest this stock at a level of Rs. 4046.90 and then we can go for long. But there is a high probability trade at the downside.

Divis Lab - Short OpportunityShort Opportunity -
Divis lab is in the downtrend. We can go for short if it crosses the support level of Rs. 4100. The CPR is narrow and at the downside so we can expect a downtrend movement in this stock. It has strong resistance of Rs. 4118.85, if this stock opens above this level and 15 min candle closes above this level then there will be bullish movement expected.

Divis Lab - Short OpportunityShort Opportunity -
Divis lab is now showing a downtrend, it has reversed from 0.5 level of fib retracement which is also showing a downtrend. We can go for short if this stock closes below Rs. 4153.40 then we can go for short. This is the level where the stock will break its descending triangle pattern.

Divis Lab - Short OpportunityShort Opportunity -
Divis lab has taken resistance of Rs. 0.382 level of fib retracement and started falling down. There is bearish movement is expected as all the international market is closing in negative sentiments. If this stock closes below the 4151.50 level then there will be a strong bearish movement is expected. Ignore this stock if it gives movement in between 4192.45 to 4163.55.

Pharma stocks base formationThis pharma stock is showing signs of reversals with a double bottom on the chart. Good levels to enter with Stop loss below the bottom formation. Pattern confirmation only if stock trades above its 200 EMA.

Divis Lab - Long Opportunity.Long Position -
Divis Lab is now showing as an uptrend. If this trend continues on Wednesday then it might give the level of Rs. 4455.25 in the next 1-2 days. But we have to be cautious at this level, as Nifty Pharma is not in a recovery zone. But there is a Minor SR at the level of Rs. 4236.45, In case markets open gap up then we can initiate a trade in the above-drawn zone, but the condition is the first candle should be closed as bullish. If these all rules fit we can go for long and can easily achieve 30 points in intraday.
Beware that if the market opens in bearish sentiments there will be correction expected.

DIVISLAB NEXT TARGETDIVISLAB now got breakout so expecting short targets on chart
support our sub brocker in stock market
like and follow

DIVISLAB BreakoutBSE:DIVISLAB The analysis is done on daily TF hence price may take few days to few weeks in order to reach the targets. Trade setup is explained in image itself. The above analysis is purely for educational purpose.

DIVISLAB - Breakout after reversal from support - Swing tradeThe analysis is done on daily TF hence price may take few days to few weeks in order to reach the targets.
Trade setup is explained in image itself.
The above analysis is purely for educational purpose. Traders must do their own study & follow risk management before entering into any trade
Checkout my other ideas to understand how one can earn from stock markets with simple trade setups. Feel Free to comment below this or connect with me for any query or suggestion regarding this stock or Price Action Analysis.

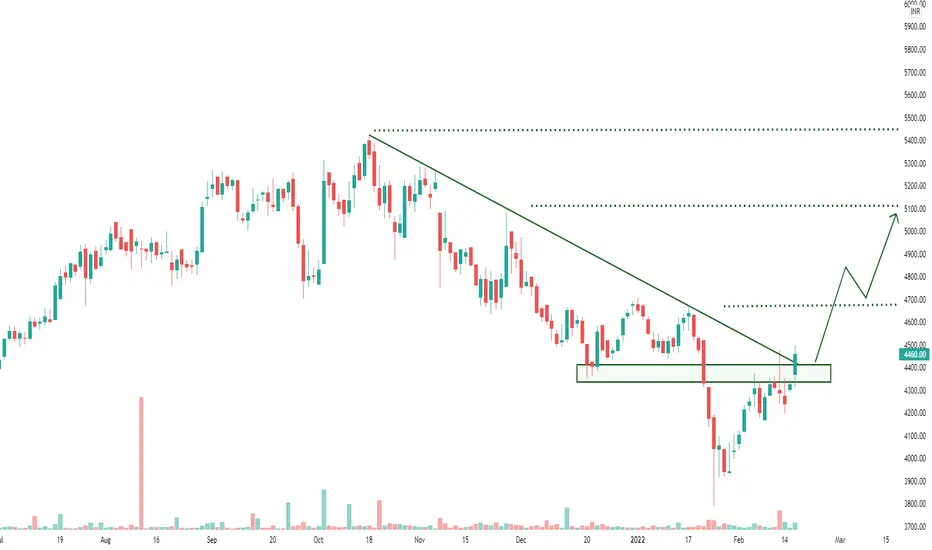
Divis LabtCmp : 4460
✅Trendline breakout, closed above resistance
✅One can look for swing trade above 4500
✅Next resistance levels 4680 / 5100 / 5400
#Divislab cash : Looks good around 4400-4430#Divislab cash -Posiitonal for 3-4 months
16 Feb 2022
Looks good around 4400-4430
stoploss 4350
Target 4580-4600/4780-4800
Cmp 4465
