DIVISLAB- RESISTANCE BODIVISLAB has given a breakout of an important resistance around 3950 in Daily time frame in 4th attempt and started trading above all EMAs. Wait for price to retest and then one can enter for a target of 4400 and 4600.
*This idea is only educational purpose, please trade at your own risk*
Trade ideas

Amazing swing trading idea for 3 December Markets I daily make educational content videos for swing / Positional trading

DIVIS LAB TARGET 4473 STOP LOSS 4025Montlhy inverse head and shoulder neckline brekaout with day bullish. And also weekly bullish from previous week. If it sustains above 4036 in intraday, it will reach the target of 4473

DIVIS LAB-Likely INV,HEAD &SHOULDER PATTERN B/OUTDIVIS LAB:Has consolidated and is showing signs of breakout above itsneckline at 3900.It has formed IHS Pattern n weekly chart,if holds above 3900 on closing basis huge n/out towards 4000+ is likely(For educational purpose only)

DIVISLAB is ready for 15% upside momentum✅ Broke resistance and 4000 level
✅Pharma Sector is looking good
✅ resistance breakout normal price action
✅ Consolidated very long
✅ Institutions Active in this stock from lower levels
✅Formed strong base before breakout

DIVISLAB | Trendline + INHS setup - Looks good for 30-40%DIVISLAB | Trendline + INHS setup - Looks good for 30-40%
CMP : 4020 (Dip : 3800)
SL : 3500
Target : 5200
1:5+ risk reward setup


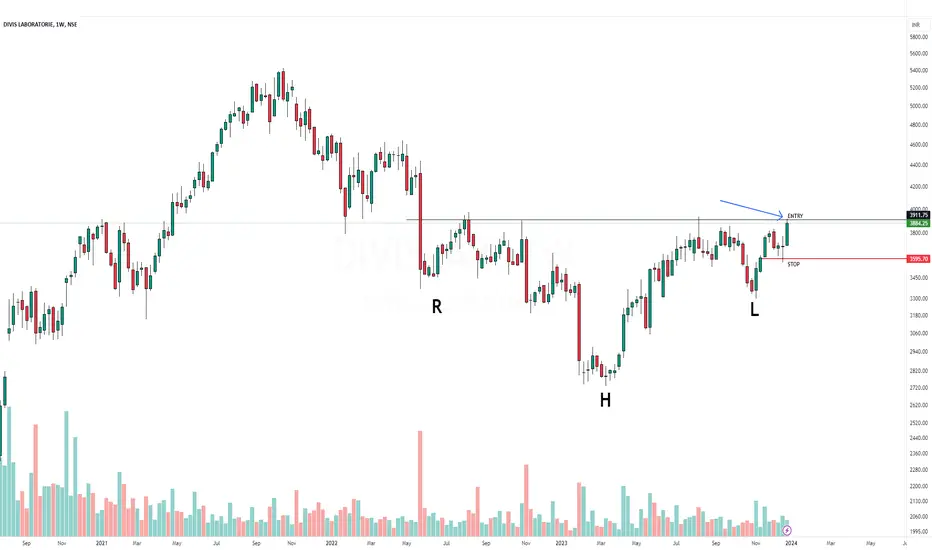
HnS PatternSince there has been multiple attempts to break this level, it is best to enter only and only if the price sustains above 3950.
Trade with strict SL = Redline for possible targets = Blueline
--- --- ---
“The key to trading success is emotional discipline. If intelligence were the key, there would be a lot more people making money trading.
I know this will sound like a cliche, but the single most important reason that people lose money in the financial markets is that they don’t cut their losses short.”
--Victor Sperandeo

DIVIS LAB ready for launch ????Get ready DIVIS labs is getting ready for another clean break.
VERY VERY Strong resistance at 3900 zones !!
strong resistance of 3 years !!
if goes above 4000 zones we can see fresh accumulation/Distribution at 5100 levels and a new lifetime high (25% returns expected) Avg buying zones near 3200 levels !
PAT/PBT has fallen almost 8% as compared to previous quarters so financials are shaky for now !
Insurance companies are increasing stake in the company in last couple of weeks !!
net profit down to 348 cr ! down 29%
52 Week high !
Public holding keeps going down now 11.7% in sep Q when compared to june Q of 12.1% !
DII up from 12.3% to 12.8% QoQ
positive signs !!!


Breakout in Divis laboratoryDivis laboratory is nearing a break out from an inverse head and shoulder pattern. Stock price closing above rupees 4000 can generate good momentum in the stock for decent returns in short to medium term.

DivislabLooking good on chart Divislab, positive breakout on weekly chart and likely to open on higher note for upcoming series, so trade 4000 CE Jan expiry 150 looks good.

DIVISLABDivis laboratorie broken head and shoulder neckline. If price sustain this level, Next this movement reach at 4210.

inverted head and shoulder pattern breakout (anticipation)entry above the line
stop below the line
Inverted head and shoulder breakout ( anticipation)
Divis Lab strong on chart Sixth attempt to cross hurdel 3962, positive divergence of MACD and RSI bullish on weekly chart, all moving avg are positive on weekly chart. Now trade setup for next month is below :-
1. 3800 CE Jan expiry @ 180.
2. 4000 CE Jan expiry @ 120 to 140.
We need to identify the price action of the security which is important for call option buyers. So one can wait to enter at 3950 or can also initiate at this level for next three weeks.

DIVISLAB INVERSE H&S BREAKOUTDivislab breaking inverse h&s pattern
with good volume strong rsi
macd crossover done
educational idea

Divis labDivis LAB
Massive Breakout abv 3855
Stock has consolidated big
Invest
Target 4000+
Option Trader 4000 ce Jnauary Series

DIVIS H&S Pattern breakout on daily charts... Targets 11% upsideDIVIS H&S Pattern breakout on daily charts... Targets 11% upside in 2 Months.
Happy Investing


Divis about to breakoutFib - the recent pull back was a mere 38.2% and indication of strength. IT will breakout above 3737. Buy it on an hourly close above 3737. R1 3920 R2 4100,


DIVISLAB looks good for long term investmentDIVISLAB looks good for long-term investment. Technically speaking, it has broken the major downtrend(solid white line) and it has also failed to make a new lower low by breaking minor downtrend(dotted white line). This resilient performance signals a bullish trend, suggesting favorable conditions for potential long-term gains.

DIVISLABDivis laboratories is forming inverted head and shoulder. Currently in right shoulder plotting. Now Price is too cheap. Price have good movement Safe trader wait for 3810 level close. Or Enter here also. Target is 4450.
