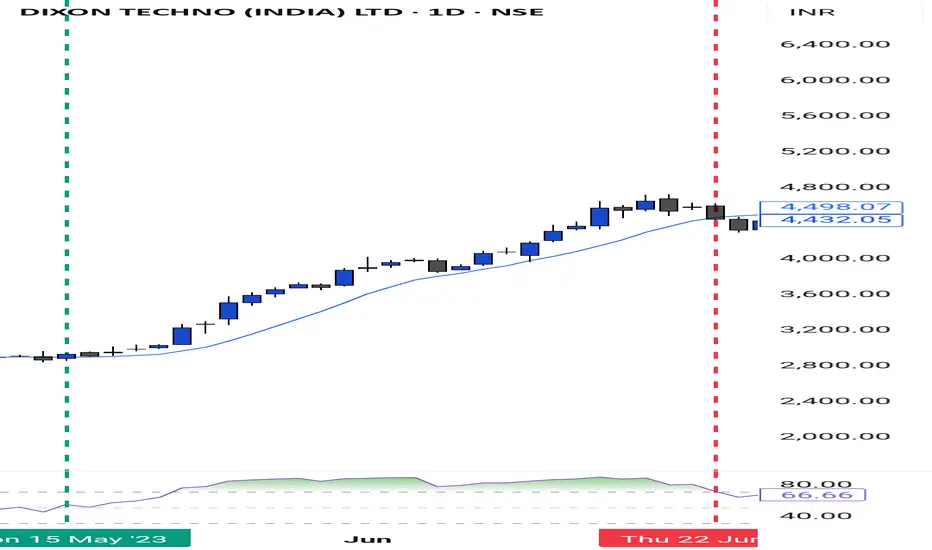
Swing Trading -Stock Options StrategySwing Trading Strategy – Stock Options:-
Tools Used: 9 SMA, RSI, Market Structure
Stock Universe: 25 Pre-Selected High Beta, Highly Liquid F&O Stocks
🔒 No further filtering or stock selection is required. Trade only within this universe.
✅ Strategy Overview
This is a swing trading strategy focused on buying stock options, using a systematic multi-timeframe confirmation approach involving:
• 9-period Simple Moving Average (9 SMA)
• Relative Strength Index (RSI)
• Market Structure
📌 Rules of Engagement
1. 📅 Monthly Timeframe – Primary Trend Filter
• The monthly candle must close above the 9 SMA.
• The RSI must be greater than 50 on the monthly chart.
2. 📆 Weekly and Daily Timeframes – Trend Confirmation
• Both weekly and daily candles must close above the 9 SMA.
• The RSI must be above 50 on both the weekly and daily charts.
3. 🕒 Entry Trigger – 15-Minute Chart (Execution Timeframe)
Once higher timeframes align:
• Switch to the 15-minute chart.
• Wait for a pullback to the 9 SMA, and enter near this level.
4. 🛡️ Stop Loss – Initial Risk Management
• Set the stop loss just below the low of the daily candle that first closed above the 9 SMA.
5. 🏁 Exit & Re-Entry Criteria
• Exit the position if the daily candle closes below the 9 SMA.
• Re-enter only when the full setup aligns again across all timeframes.
🔁 Profit Trailing Strategy
🔒 Step 1: Lock-In at Cost
• After three consecutive bullish daily candles, trail your SL to breakeven (your entry price).
📉 Step 2: Dynamic Trailing
• For every 5 bullish daily candles,
➤ Trail your SL to the lowest low of the 1st candle in that group.
• Continue this until a daily close below the 9 SMA, at which point exit completely.
⏰ Option Expiry Guidelines
• Enter trades only after 2 days of expiry (e.g., from Friday onwards for weekly expiry on Thursday).
• Exit trades before the last 2 days of expiry to avoid theta decay.
• Choose liquid strike prices in 0.5 or 1-point intervals.
▸ Example: If the stock is at ₹439, pick ₹400 ITM or ₹450 for better liquidity.
⚠️ Additional Notes
• Strictly trade within the 25 pre-identified high beta, liquid F&O stocks.
• This strategy performs best in trending markets.
• Avoid overtrading or deviating from the setup rules.
• Maintain a trading journal to track entries, exits, and stop loss adjustments.
•
📊 High Beta, Liquid F&O Stocks (Current List)
Adani Enterprises Adani Power Axis Bank IndusInd Bank Bajaj Finance Kotak Mahindra Bank HDFC Bank Tata Motors Larsen & Toubro JSW Steel Reliance Industries IndiGo Tech Mahindra Titan Sun Pharma Cipla Bajaj Finserv BPCL Mahindra & Mahindra Aurobindo Pharma Dr Reddy’s Laboratories Shriram Finance Lupin Container Corporation (Concor) Siemens
VIMP - Same process will be followed for Downtrend/PE buying. Montly candle must give its closing below 9 SMA with RSI 50 crossing below.
DIXON trade ideas
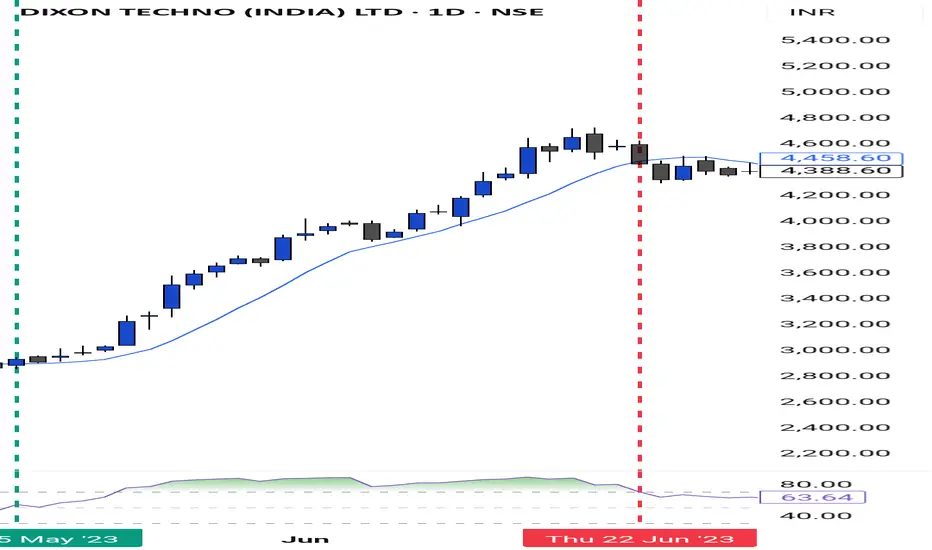
Swing Trading - Stock Options Buying Strategy📈 Swing Trading Strategy – Stock Options
Tools Used: 9 SMA, RSI, Market Structure
Stock Universe: 25 Pre-Selected High Beta, Highly Liquid F&O Stocks
🔒 No further filtering or stock selection is required. Trade only within this universe.
✅ Strategy Overview
This is a swing trading strategy focused on buying stock options, using a systematic multi-timeframe confirmation approach involving:
• 9-period Simple Moving Average (9 SMA)
• Relative Strength Index (RSI)
• Market Structure
📌 Rules of Engagement
1. 📅 Monthly Timeframe – Primary Trend Filter
• The monthly candle must close above the 9 SMA.
• The RSI must be greater than 50 on the monthly chart.
2. 📆 Weekly and Daily Timeframes – Trend Confirmation
• Both weekly and daily candles must close above the 9 SMA.
• The RSI must be above 50 on both the weekly and daily charts.
3. 🕒 Entry Trigger – 15-Minute Chart (Execution Timeframe)
Once higher timeframes align:
• Switch to the 15-minute chart.
• Wait for a pullback to the 9 SMA, and enter near this level.
4. 🛡️ Stop Loss – Initial Risk Management
• Set the stop loss just below the low of the daily candle that first closed above the 9 SMA.
5. 🏁 Exit & Re-Entry Criteria
• Exit the position if the daily candle closes below the 9 SMA.
• Re-enter only when the full setup aligns again across all timeframes.
🔁 Profit Trailing Strategy
🔒 Step 1: Lock-In at Cost
• After three consecutive bullish daily candles, trail your SL to breakeven (your entry price).
📉 Step 2: Dynamic Trailing
• For every 5 bullish daily candles,
➤ Trail your SL to the lowest low of the 1st candle in that group.
• Continue this until a daily close below the 9 SMA, at which point exit completely.
⏰ Option Expiry Guidelines
• Enter trades only after 2 days of expiry (e.g., from Friday onwards for weekly expiry on Thursday).
• Exit trades before the last 2 days of expiry to avoid theta decay.
• Choose liquid strike prices in 0.5 or 1-point intervals.
▸ Example: If the stock is at ₹439, pick ₹400 ITM or ₹450 for better liquidity.
⚠️ Additional Notes
• Strictly trade within the 25 pre-identified high beta, liquid F&O stocks.
• This strategy performs best in trending markets.
• Avoid overtrading or deviating from the setup rules.
• Maintain a trading journal to track entries, exits, and stop loss adjustments.
•
📊 High Beta, Liquid F&O Stocks (Current List)
Adani Enterprises Adani Power Axis Bank IndusInd Bank Bajaj Finance Kotak Mahindra Bank HDFC Bank Tata Motors Larsen & Toubro JSW Steel Reliance Industries IndiGo Tech Mahindra Titan Sun Pharma Cipla Bajaj Finserv BPCL Mahindra & Mahindra Aurobindo Pharma Dr Reddy’s Laboratories Shriram Finance Lupin Container Corporation (Concor) Siemens
VIMP - Same process will be followed for Downtrend/PE buying. Montly candle must give its closing below 9 SMA with RSI 50 crossing below
Buy Dixon
Dixon has completing / completed correction of the present wave as a flat structure as given in the charts.
Buy to trade next full wave or with a short-term target of 0.618 to 0.786 of the last swing (for futures traders).

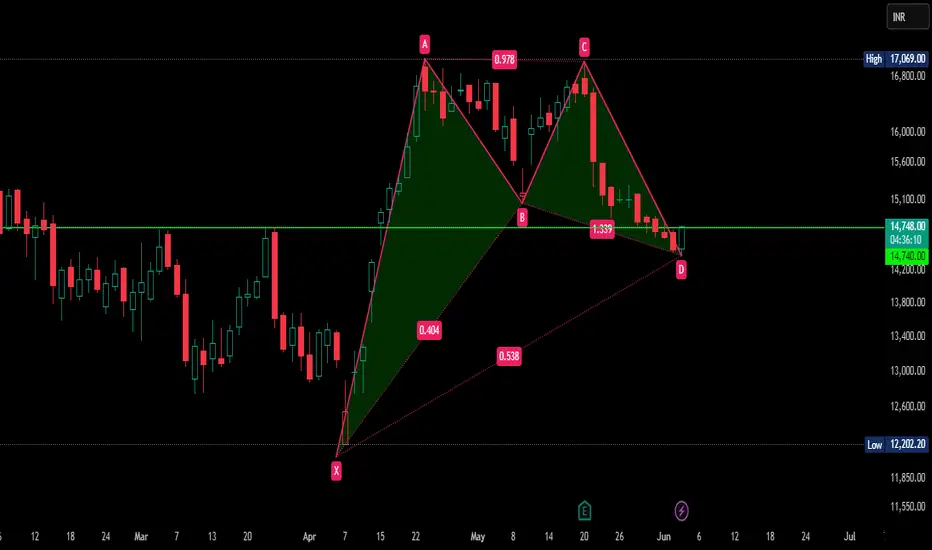
DIXON FORMING BAT PATTERNHere mentioned stockis DIXON which is forming BAT PATTERN you can see clearly here and taking reversal if it break previous day candle it will confirm and it is to break previous day candle pay attention its day chart.It is trading at 14735 which is resistance as well.here i marked that level in green.It is not my buy/sell call,just an information.
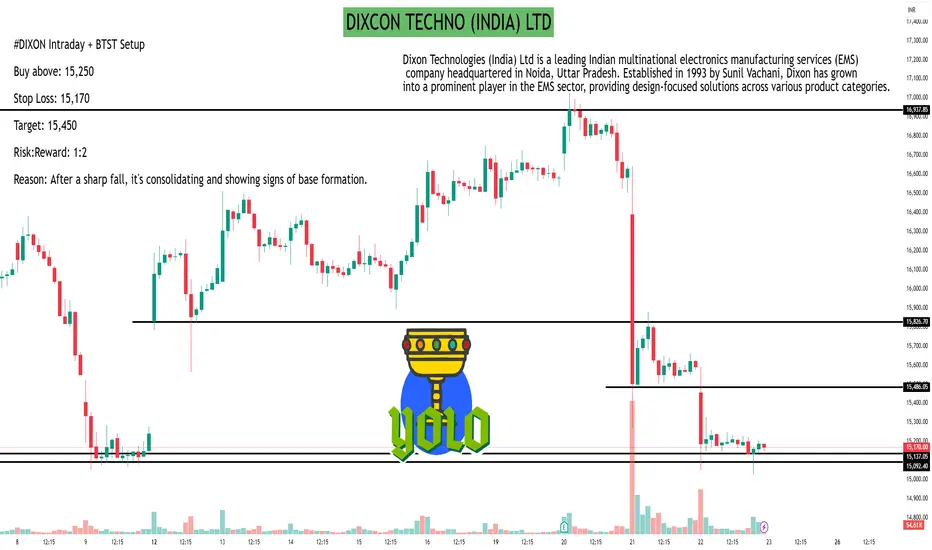
DIXCON TECHNO (INDIA) LTDAs of May 22, 2025, Dixon Technologies (India) Ltd (NSE: DIXON) closed at ₹15,170.00, reflecting a 2.84% decline from the previous close of ₹15,612.00.
30-Minute Support and Resistance Levels
Based on the 30-minute technical analysis, the following pivot points have been identified:
Classic Pivot Points:
Resistance Levels:
R1: ₹15,184.66
R2: ₹15,305.33
R3: ₹15,383.66
Support Levels:
S1: ₹14,985.66
S2: ₹14,907.33
S3: ₹14,786.66
Pivot Point: ₹15,106.33
Fibonacci Pivot Points:
Resistance Levels:
R1: ₹15,182.35
R2: ₹15,229.31
R3: ₹15,305.33
Support Levels:
S1: ₹15,030.31
S2: ₹14,983.35
S3: ₹14,907.33
Pivot Point: ₹15,106.33
Camarilla Pivot Points:
Resistance Levels:
R1: ₹15,082.24
R2: ₹15,100.48
R3: ₹15,118.73
Support Levels:
S1: ₹15,045.76
S2: ₹15,027.52
S3: ₹15,009.27
Pivot Point: ₹15,106.33
These levels can serve as reference points for intraday trading strategies.
Technical Indicators Overview
The current technical indicators suggest a bearish outlook:
Relative Strength Index (RSI): 30.31, indicating the stock is approaching oversold territory.
Moving Average Convergence Divergence (MACD): -311.32, signaling downward momentum.
Average Directional Index (ADX): 53.38, suggesting a strong trend.
Commodity Channel Index (CCI): -112.93, indicating a potential oversold condition.
Rate of Change (ROC): -8.43, reflecting negative momentum.
Bull/Bear Power: -681.10, emphasizing bearish dominance.
Overall, the technical analysis points to a strong sell signal.
Analyst Ratings
Analyst consensus on Dixon Technologies is mixed:
Strong Buy: 8 analysts
Buy: 8 analysts
Hold: 3 analysts
Sell: 6 analysts
Strong Sell: 1 analyst
This distribution indicates a cautious stance among analysts, with a notable number recommending buying the stock, while others advise selling.
DIXON 16541 LOOKING GOOD FOR 5-10% MOVE1.Symmetric triangle pattern in making
2.Results on 20th may good expected
3.5-10% easy move expected above 16800 resistance zone
4. Volume rising before results now

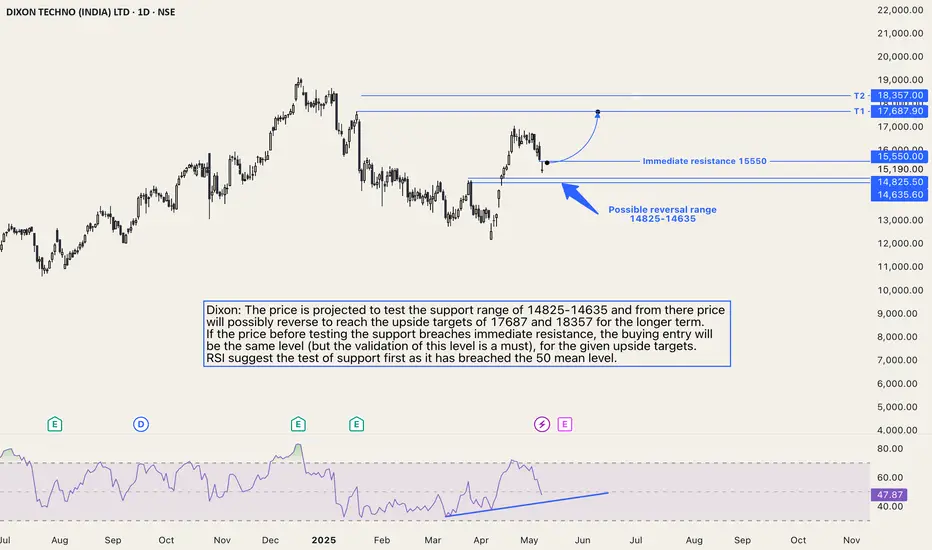
DIXON: Trading strategy for nre uptrend.Dixon: The price is projected to test the support range of 14825-14635, and from there price will possibly reverse to reach the upside targets of 17687 and 18357 for the longer term.
If the price before testing the support breaches immediate resistance, the buying entry will be the same level (but the validation of this level is a must), for the given upside targets.
RSI suggest the test of support first as it has breached the 50 mean level.
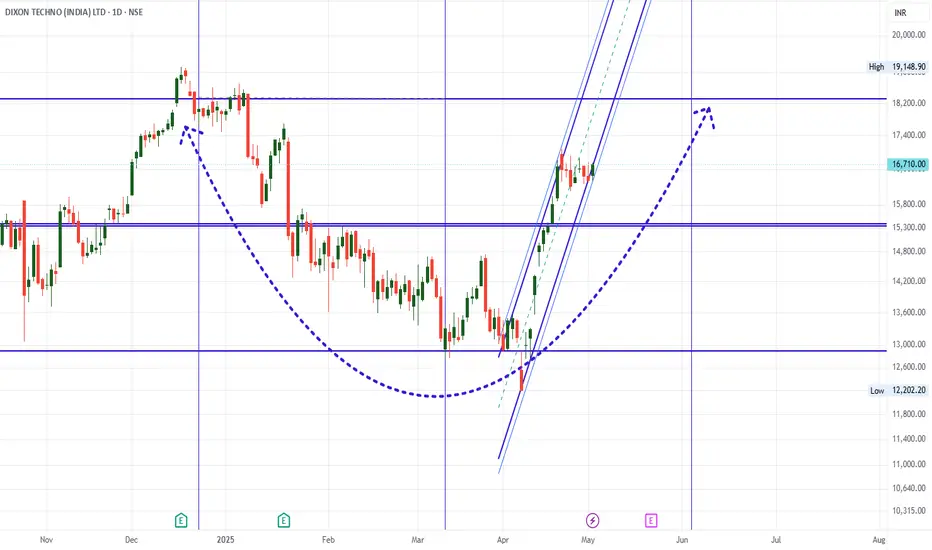
DIXON 10% upside possibility in next 10 daysDIXON 10% upside possibility in next 10 days.
Dixon is breaking out from Flag Pattern the targets can be much higher but 10% looks possible in next 10-15 Days.
LTP - 16710
Targets - 18400+
SL - 16200
Happy Investing.
Dixon Technologies Bullish Bias 10% upsideThe Stock has been consolidating for a while
As visible from the RSI the stock has given a nice breakout from the range
The stock price was also falling and took support near 200day EMA zone
The price has reversed from the selling zone
3 days constant increase in the price and reversal with a W Breakout pattern
The overall sentiment looks really bullish for the counter
Also, the tariff pause shall be helping the business for a short term
Looks really bullish to me.
Caution: Trade as per your risk appetite.

Dixon Technologies (India) Ltd Trendline Breakout Dixon Technologies (India) Limited, incorporated in 1993 , is a Electronic Manufacturing Services (EMS) company with operations in the electronic products vertical such as consumer electronics, lighting, home appliance, closed-circuit television cameras (CCTVs), and mobile phones. It also undertakes reverse logistics operations. Besides, it manufactures security surveillance equipment, wearables & audibles, AC-PCBs. Recently, it has entered a JV with Imagine Marketing Private Limited for designing and manufacturing wireless audio solutions in India.

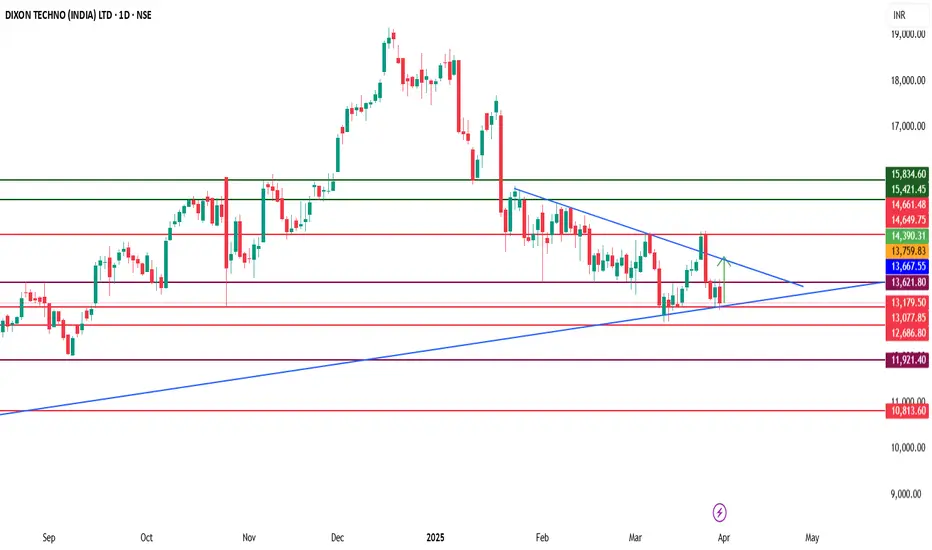
Dixon Technologies: Key Levels & Market Outlook📌 Dixon Technologies (NSE: DIXON) – Key Levels & Market Outlook
Dixon Technologies (DIXON) is currently trading above a crucial support zone of ₹13,000-₹12,800. If the stock sustains this level and breaks above the ₹13,630 resistance, it could see an upside move toward ₹14,000-₹14,600. However, a breakdown below ₹12,800 may lead to further downside pressure.
🔍 Technical Indicators:
📊 Supertrend (10,3): The indicator is currently in a buy mode, supporting a bullish outlook as long as ₹12,800 holds.
📈 Fibonacci Retracement: The ₹13,630 resistance aligns with a key retracement level; a breakout above this could confirm strength.
📉 ADX (Average Directional Index): Currently at 23, suggesting a developing trend; a move above 25-30 would indicate strong bullish momentum.
📊 OBV (On-Balance Volume): Rising OBV signals strong accumulation, supporting an upward breakout scenario.
📌 Key Levels to Watch:
✅ Support Zone: ₹13,000-₹12,800
📍 Resistance Level: ₹13,630
🚀 Upside Targets: ₹14,000-₹14,600
⚠ Breakdown Risk: Below ₹12,800, the stock may slide toward ₹12,500.
A sustained move above ₹13,630 could accelerate buying momentum, pushing Dixon toward ₹14,000-₹14,600. On the other hand, a break below ₹12,800 may invite selling pressure. Keep an eye on sector trends, demand in electronics, and institutional activity for further confirmation.
Dixon Corrects After Strong Bull Run Topic statement:
Dixon was on a strong bullish streak, becoming overbought, and has finally faced a correction after breaching its up trendline, leading to increased selling pressure.
Key points:
- The up trendline was breached, triggering selling pressure.
- Price has taken support at the 38.2% retracement level.
- The stock is still above the 90-day EMA, and the weekly MFI is at 30.
- If the 38.2% retracement level fails to hold, further correction to the 50% retracement level is possible.

Dixon Technologies (India) Ltd - Technical Analysis & Outlook
Dixon Technologies (NSE: DIXON) has been experiencing a notable downtrend after failing to sustain its bullish momentum. The stock recently broke below a key support level, confirming a bearish structure.
Key Observations:
Price Action: The stock has breached the lower boundary of the rising wedge, indicating further downside risk.
Support & Resistance:
The immediate support is around ₹12,825, aligning with the 52-week high-low level, while resistance is seen at ₹14,000 - ₹15,000.
Outlook:
If Dixon fails to hold the ₹12,825 support, we may see a further decline toward ₹12,000 or lower. However, a bounce from this level with strong volume could signal a short-term recovery. Traders should watch for signs of reversal before taking long positions.
Disclaimer:
This is for educational purposes only and not financial advice. Always do your own research before investing.

Dixon Technologies (India) LimitedDixon Technologies (India) Limited, incorporated in 1993 , is a Electronic Manufacturing Services (EMS) company with operations in the electronic products vertical such as consumer electronics, lighting, home appliance, closed-circuit television cameras (CCTVs), and mobile phones. It also undertakes reverse logistics operations. Besides, it manufactures security surveillance equipment, wearables & audibles, AC-PCBs. Recently, it has entered a JV with Imagine Marketing Private Limited for designing and manufacturing wireless audio solutions in India.
Market Leadership:- Dixon is the one of the largest LED TV manufacturers in India and it services more than 35% of India’s requirement. It is the largest ODM player in lighting & has the largest capacity

DIXON - SHORTShort Dixon up to 16,000
Targets: 14,325, 13,720
Stop Loss: 16,500
Note: This is a slightly risky trade on short futures or buying Puts, as the majority of the price movement has already occurred today. The stock may consolidate for a while before making any further significant moves.
Disclaimer: This information is for educational purposes only and should not be considered as financial advice. Please consult with a qualified financial advisor before making any investment decisions.

Price + time correction of wave iii - Abhi iska ho gayaDixon will become a trading stock now . Its investment value is over because of an extended wave iii. Its not a buy and hold stock now . We dont know how much and how long it will correct.

DIXON technologies ltd**Dixon Technologies Ltd – Comprehensive Fundamental and Technical Analysis**
**Company Overview:**
Dixon Technologies Ltd is a leading Indian electronics manufacturing services (EMS) company, specializing in the design, development, and manufacturing of products across various sectors, including consumer electronics, home appliances, lighting, and mobile phones. Established in 1993 and headquartered in Noida, the company has established itself as a key player in India's electronics manufacturing industry.
**Recent Financial Performance:**
- **Revenue:** For the fiscal year ending March 31, 2024, Dixon Technologies reported a total revenue of ₹3,322.6 crore.
- **Net Profit:** The company achieved a net profit of ₹324.5 crore in the same period.
- **Earnings Per Share (EPS):** The EPS for the year was ₹45.5. citeturn0search3
- **Gross Margin:** The gross margin stood at 15.7%, indicating the percentage of revenue retained after incurring the direct costs associated with producing the goods sold.
- **Net Profit Margin:** The net profit margin was 9.8%, reflecting the company's ability to convert revenue into actual profit.
**Key Financial Metrics:**
- **Market Capitalization:** As of February 14, 2025, Dixon Technologies' market capitalization is approximately ₹85,298 crore, classifying it as a large-cap company.
- **Price-to-Earnings (P/E) Ratio:** The P/E ratio is 102.68, indicating a premium valuation compared to industry peers.
- **Price-to-Book (P/B) Ratio:** The P/B ratio is 38.3, suggesting a high valuation relative to its book value.
- **Debt-to-Equity Ratio:** The debt-to-equity ratio is 0.47, indicating a moderate level of debt financing relative to equity.
**Stock Performance:**
- **Current Stock Price:** As of February 14, 2025, the stock price is ₹14,199.50.
- **52-Week Range:** The stock has traded between ₹6,410.00 and ₹19,148.90 over the past year, indicating significant volatility.
- **Recent Performance:** Over the past year, the stock has shown a return of 28.7%.
**Analyst Insights:**
ICICI Direct initiated coverage on Dixon Technologies with a "BUY" rating and a target price of ₹4,470, valuing the company at 50x P/E on FY24E EPS.
**Investment Considerations:**
- **Strengths:**
- **Market Leadership:** Dixon Technologies holds a significant share in India's EMS sector, benefiting from the country's growing demand for electronic products.
- **Diversified Portfolio:** The company's extensive product range across various sectors provides a balanced revenue stream.
- **Risks:**
- **Valuation Concerns:** The high P/E and P/B ratios suggest that the stock is trading at a premium, which may pose risks if growth expectations are not met.
- **Market Volatility:** The stock has exhibited significant price fluctuations, which may pose risks for investors.
**Conclusion:**
Dixon Technologies Ltd demonstrates robust financial performance and holds a strong position in India's EMS market. While the stock's premium valuation and volatility warrant cautious consideration, the company's growth prospects and market leadership make it a noteworthy entity in the electronics manufacturing sector.
**Investment Strategy:**
- **Short-Term Traders:** Consider entering near support levels around ₹13,500, with a target price of ₹15,000. Maintain a stop-loss below ₹12,000 to manage downside risk.
- **Long-Term Investors:** The stock's current valuation and growth prospects make it a potential candidate for long-term investment, with a target price of ₹16,213. Regularly assess the company's performance and market conditions to make informed decisions.
*Note: This analysis is for informational purposes only and should not be construed as financial advice. Investors are encouraged to conduct their own research or consult with a financial advisor before making investment decisions.*

dixon technologies india ltd - technical💕Founded in 1993, #dixontechnologies specializes in manufacturing ⚡️electronic products across several segments including consumer electronics, home appliances, lighting, mobile phones, and security systems. Here's an 📉chart overview based on current information 🥰

Dixon technology is ready for the new next high of 29500 According to my Analysis dixon is going to be very bullish and this is the most important support for this stock.

Mastering the Flag Chart Pattern for Profitable BreakoutsFlag Chart Pattern: A Key to Successful Breakouts
Hello Traders!
I hope you’re all doing well! Today, we’ll be taking a deep dive into the Flag Chart Pattern . This continuation pattern is a favorite for traders looking for a strong trend to follow. If you want to spot reliable breakouts, the Flag pattern is something you’ll want to master. It can help you ride strong trends and get in at the right moment after a brief consolidation.
What is the Flag Pattern?
The Flag Chart Pattern forms after a sharp price movement (the Flagpole ), followed by a brief consolidation period. The consolidation forms a rectangular or parallelogram shape, which is the Flag . Once the price breaks out of this consolidation, it often continues in the same direction as the initial Flagpole .
In other words, the Flag Pattern signals that the market is taking a quick breather before continuing its strong momentum in the same direction.
Key Characteristics of the Flag Pattern
Flag Pole : The initial sharp price movement (either upward or downward), showing strong momentum.
Flag : The consolidation phase that follows the pole, typically characterized by parallel trendlines, forming a rectangular or parallelogram shape.
Breakout : The price breaks above (for a bullish pattern) or below (for a bearish pattern) the flag's upper or lower boundary, confirming the continuation of the trend.
Volume Confirmation : Volume usually decreases during the consolidation (flag) phase, followed by a surge in volume at the breakout, which confirms the strength of the move.
How to Trade the Flag Pattern Like a Pro
Entry Point : The best time to enter is after the price breaks above the flag’s upper boundary (for bullish setups).
Stop Loss : Place your stop loss just below the flag’s lower boundary or the most recent swing low, to minimize risk.
Profit Target : For setting targets, measure the height of the flagpole and project that distance from the breakout point to set your profit target.
Real-World Application: Dixon Technologies Case Study
Looking at the Dixon Technologies chart, we can see a clear Flag Chart Pattern forming. After a sharp price increase (the flagpole ), the stock consolidated, creating the flag . Once the price broke out above the flag’s upper trendline, the price continued to rise, confirming the continuation of the uptrend. The expected target can be calculated using the flagpole’s height, projecting it from the breakout point.
Conclusion
The Flag Chart Pattern is one of the most reliable continuation patterns in technical analysis. By recognizing the flagpole , waiting for the breakout, and managing your risk effectively, you can increase the chances of a successful trade.
Have you traded using the Flag pattern?
Share your experiences in the comments below! Let’s learn together and keep improving our trading strategies!

Bulling Pole and FLAG Pattern in DIXON as in NIFTY It can be easily viewed and understood by having a look at the chart of DIXON that a Bullish POLE and FLAG pattern in making and buying can be done with a SL of 200 points and profit of 500 points .

Dixon Technologies Near Oversold Levels After Trendline BreakDixon Technologies (India) Ltd. has recently faced a heavy selling pressure triggered by the third quarter earnings results. The stock reported a whopping profit growth of 122% QoQ. Investors should monitor the stock's performance closely to identify optimal entry points.
Key Points:
1. Uptrend Line Breach: The stock has broken below its established uptrend line, signaling a possible change in trend direction.
2. Potential Sideways or Corrective Movement: This breach suggests that the stock may enter a period of sideways movement or further correction.
3. Proximity to 180-Day Moving Average: The current price is near the 180-day moving average, indicating an oversold condition.
4. Buying Opportunity: Purchasing the stock near or below the 180-day moving average could be advantageous for investors.

Dixon - Sell on rise - 1hr TFDixon technologies looking bearish on 1hr after the Q3 results as company didn't perform as per expectations along with a high PE ratio and reducing demand for consumable appliances. Price is about to hit the crucial 15750 levels. Which was a support level previously. We can look for sells near 15750 to 15800 zones after a structure shift in 15 min TF.
