Eris breaks out after taking support on trend lineEris crosses Resistance at 600 after taking support from UpTrend Line. Next resistance at 630.
ERIS trade ideas

ERIS is Willing to form Higher HigsERIS above 600 on closing basis will form higher highs on daily chart and also breaks downward sloping trendline. once it breaks it can go upto 630.


ERIS At weekly SupportERIS has a weekly support at 555 level. which is also coincides with 21W EMA. and 21W EMA is sloped upwards. it's better to accumulate at current levels for long term.

ERIS - Breaking out Descending Trendline and 40 Months' STR ZoneHi Investors,
ERIS has been falling since 2018 Apr . After three years, Price is turning bullish while breaking both Descending trend-line and 40 months' STR Zone.
I hope you will benefit from this knowledge
-MetaVish

BUY ERIS LIFESCIENCES; TARGET OF 650 IN 30-35 SESSIONSERIS has turned bullish; can buy at current level for target of 650 in coming 30-35 sessions.

Eris Lifesciences, 1D TFBeautiful triangle pattern, Stock retesting its previous Resistance level.
How to identify Retest/Retrace: the volume will increase during the breakout & will gradually fall during the retrace.
Perfect scenario to go long by end of the day if the volume & candle stick formation remains same.
Reasons to enter: 1. Low risk Trade, 2. Entering at Support levels, 3. Risk of only 12-15 points


Eris : good for buying if sustained above 580Eris is showing strength even after massive sell in nifty (21 Dec 2020)
Broken weekly tf trendline and sustaining above 200 dma
Forming inverted head and shoulder
a good buy can be initiated above 580 with Sl 535 for the target 665
Disclaimer : This analysis only for education purpose


ERIS :: Symmetrical Triangle FormationA symmetrical triangle pattern is observed in this stock. Traders can look for a breakout opportunity to get hold of some profits.

Ascending Triangle PatternPerfect Example of Triangle Pattern. I think it will give breakout in few days
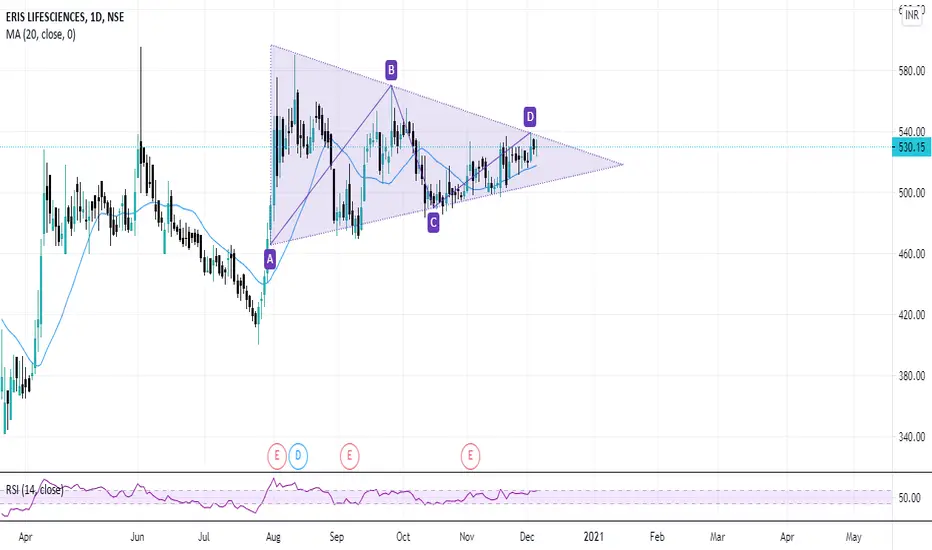
Morning Star pattern.Buy above the LTP-530.15Morning star pattern with good volume,also rsi pointing upwards .Go long For above target with the mentioned stop loss.


ERIS looking for triangle brekoutERIS looking for a triangle breakout and also trading at weekly resistance
RSI is above 50 on both daily and weekly scale, indicating bullishness intact.
Higher Lows formed and same high maintained on weekly scale from March-2020.
Narrow Central CPR is observed, indicating trend ahead.
RSI reversed repeatedly at 60 levels, This time hopefully it can break it and gain momentum. currently RSI is around 54 level.


ERIS life science 1D chart - Fundamentally strong companyPlease enter the trade once u get a proper breakout or reversal from the levels, Do not hesitate to contact me with any queries. Kindly support my views. Thanks

Eris LifesciencesEris Lifesciences can be bought at CMP 518 for the short term with target-529,546,557
