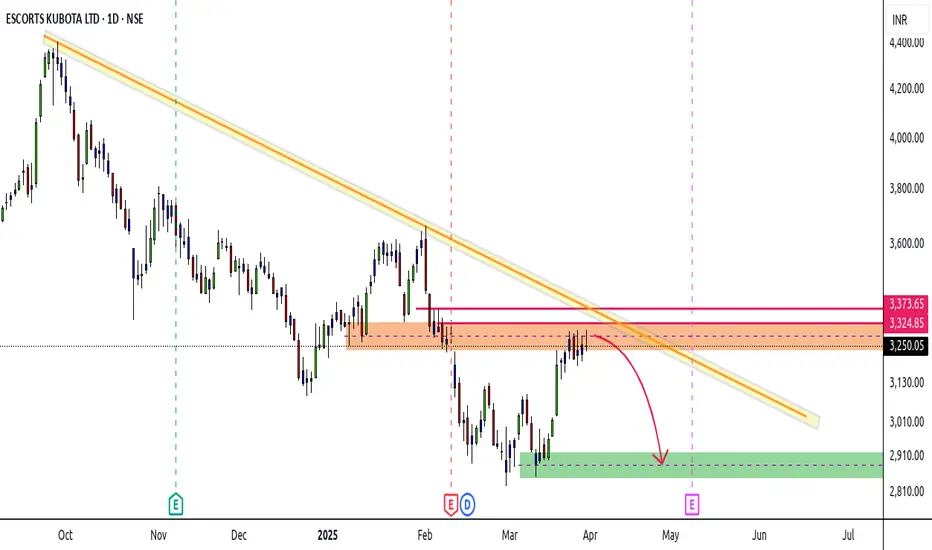
Escorts - Stuck !!!Stock currently stuck in DBD as well as Strong Flip Zone
Area of resistance from 3280 - 3320
Upside Sl 3370
Downside 2900 - 2930
Lower Time Frame (Stock in a zone)
Possible entry either near top or on the break of lower zone in LTF
ESCORTS trade ideas
ESCORTS : BULLISH due to inverted Head & Shoulder
INVERTED HEAD & SHOULDER -
market made a clear inverted head & shoulder pattern and broke out of it indicating strong upward momentum for the stock
VOLUME SURGE -
market has shown strong volume surge with the breakout candle indicating strong upward pressure for the stock
PROFIT -
till 3266

Swing Trade Projection for ESCORTS KUBOTA LTDCurrent Analysis:
Momentum Indicators:
Rate of Change (ROC): Currently at 4.84, above the 0 line, indicating a positive momentum.
Commodity Channel Index (CCI): The CCI is at 196, signaling strong upward momentum.
Relative Strength Index (RSI): At 58 on a daily basis, showing a positive trend and potential for further upside.
Trade Setup:
Entry Point: Consider entering near the current level of 3,220 INR (or on pullbacks to around 3,263 INR, if there's a rejection and potential for a rebound).
Target 1: 3,435 INR (primary target, crucial resistance).
Target 2: 3,565 INR (near-term target).
Extended Target: 3,810 INR (if momentum continues).
Stop Loss: Set a stop loss around 3050 INR, below the support zone to manage downside risk.
Disclaimer: This is not financial advice and is for educational purposes only. Please assess your own risk tolerance and consult a financial advisor before making any investment decisions. Past performance is not indicative of future results.

Observe the correction when 2 degrees of wave 3 end The title is explained in the chart. The chart is Fibonacically correct if anyone takes an effort to measure it . I have not shown these in the chart . I have observed a very peculiar occurrence in many charts i.e an extended wave i in wave iii position , this normally does not happen in a wave 3 position because then wave 3 would look like a diagonal pattern . This could be a wave 5 as per log scale . But anyway correction in the range of wave 2 is imminent . Money is more important that wave count . Regards

Escorts KubotaSL 1Hr candle close only, Target Trigger Price
All detail for chat. good entry at mark price only. and must stoploss minimum risk and good profit. risk ratio 1:1 to manage modified SL. This is not call, Just my idea. Please understand your risk and take full responsibility of your actions


Escorts - BearishPrevious support now turned resistance zone
Also DBD base zone
Zone area 3380 - 3405
Point of rejection
View negates above 3420
Downside targets 3300 - 3225

Escorts - Long-term trendline support, low risk buyEscorts is at value buy (low risk), demand zone.
Price has continuously respected the trendline and weekly RSI has not broken 40 support (see highlighted arrows)
Buy after a weekly green candle appears and price starts to trade above it in daily, stop loss will can be 0.5% below the weekly candle close.
Hold for a potential target of 22% upside.
Good luck and Happy trading!

ESCORTSMultiple order blocks in multi time frames stock since potential to moving around 30% in upcoming trading sessions.

ESCORTS is very bearish after the breakdown
DESCENDING TRIANGLE :
Due to the breakdown from descending triangle pattern the stock has become very bearish till the target price is reached
TESTED STRONG SUPPORT-RESISTANCE ZONE :
The stock has reversed from strong resistance level recently which was earlier tested several times as a strong support
TARGET LEVEL :
the price has a target level of 3196

ESCORTS - Possibly Wolfe Wave Pattern formationCMP: 3400
TF: 75 Minutes
Script is making an ending pattern to complete the 4th wave. I hope it will bottom out around 3250-300 levels. Possible pathway is explained here in this chart.
Trendline support is also around the levels mentioned above
Larger TF wave counts is attached below..
Approach: Better to wait for the price to go below the lower trendline and come back in to the structure again to take the trade.
I am not a SEBI registered Analyst. Views are personal and for educational purpose only. Please consult your Financial Advisor for any investment decisions. Please consider my views only to get a different perspective (FOR or AGAINST your views). Please don't trade FNO based on my views.

ESCORTS near support buy ESCORTS at 3524 swing trade opportunity near support zone.
target - 3820
sl - 3438
follow risk reward
Disclaimer -
videos, presentations, and writing are only for educational purposes and are not intended for investment advice. I can't promise the accuracy of any information provided. please consult with your financial advisor.

Targets for ESCORTSTarget 1,2,3,4 mentioned here.
Keep holding your position.
This is the consolidated period once breakout happens, its goes as per analysis

ESCORTS
The stock is currently approaching its dual support placed between 3340 and 3100 (61.8% FR level & 100 Week EMA).
The Weekly RSI is also coming to its Oversold level.
Past price corrections in this on-going up-move has bottomed out at the 61.8% FR and 100 Week EMA.
The Weekly MACD crossing above its Trigger line would confirm resumption of the up-move.

Auto in focus Escorts CMP 3620
Elliott- This is a complex corrective pattern. Two zig zag corrective pattern separated by X which is also a zig zag. The current dip is wave 2 and is done. Wave 3 should begin from here which will be a strong upmove.
Fibs- the halt at 61.85 from a higher swing is telling me the trend is intact and strong.
RSI- the dip above the bull zone is telling me the stock has regained its strength.
MA- taking support above moving average is again very positive.
Conclusion - to me its a very very good buy here.

ESCORTS LTDStock Name : #ESCORTS LTD
LTP : 3750
Price is moving in a Higher highs and higher lows pattern
Showing a bullish uptrend 15 Minutes Time frame..
15 Minutes breakout done after that Bearish Marubozu candle indicating Retest
We Can add it above: 3800 Range
Targets Will be 4000
Stoploss 3755

ESCORTS AT DEAMND ZONEESCORTS at daily Demand zone.
Invalid below 3740
Not a buy/sell recommendation

Escorts Triangle BreakoutBreakout from triangle pattern with volume spike
RSI showed bullish divergence
ADX positive crossed above negative
MACD line crossed above signal line
Multiple pattern confirmation seen
High chances of makes new all time high at level 4750

ESCORTS Trendline BreakoutTrendline Breakout Setup, RSI above 60, Stoch Positive Cross over, MACD also positive cross over,
High Volume
Disc: for educational purpose, not a recommendation

ESCORTS (Breakout Soon)What I have seen:
After listing stock went into a range.
Gave range breakout after 17 years.
Price making continuously Higher high formation on Monthly TF.
Price never change the structure from Lower high to Higher low.
Recovery after covid fall RSI never touched 50
After June 2022 RSI made Lower high formation.
Conclusion:
Stock is in strong bull run.
Never think to short the bull stock.
If any correction happens due to any reason take as an opportunity to invest.
Keep hold the stock till the structure shift from higher high to lower high & lower high to higher low.
Closing above 4450 It may hit our PRZ Zone which is marked on chart.
If you are long term investor then just hold this stock till the structure shift.
For mid to short term trader may book their profit at PRZ Zone.
Risk taker may add quantity in the range of 3600-4400
Idea got invalid below 2630
I am not a SEBI Registered. This analysis is purely for educational purposes only.
.
If you gain some learning from this chart, then please like this post for more reach & also do comment if you have any questions regarding this.

escorts kubota ltd, bullishMoved above short term moving averages.
Had support and resistance around 3900, which it broke with good volume.
Crossed upper BB.
Super trend changed to buy after 34 sessions.
High delivery, macd has bullish crossover
RSI at 67.
SL at 3600
tgt 1 : 4200
tgt 2 : 4400

Breakout in ESCORTS Descending Triangle Breakout Setup
RSI above 65 and rising
Trading above EMA50
Volume spurt
Disc: for study, not a recommendation

ESCORTS - Symmetrical triangle -Breakout -DailyThis image shows a price chart for Escorts Kubota Ltd stock,
Here's an analysis of the key elements:
1. Price Action:
- The stock has been in an overall uptrend since April.
- It formed a symmetrical triangle pattern from June to September, which it has now broken out of to the upside.
- The current price is 4,079.25 INR, up 4.88% on the day.
2. Key Levels:
- There's a significant resistance level around 4,400 INR, which was the previous high in June.
- The breakout level from the triangle pattern (around 3,920 INR) may now act as support.
3. Volume:
- There's a notable spike in trading volume coinciding with the recent price breakout, suggesting strong buying interest.
4. RSI (Relative Strength Index):
- The RSI is currently at 67.60, indicating strong momentum but not yet in overbought territory.
- There was a bullish divergence between the RSI and price from July to September, with the RSI making higher lows while price made lower lows.
5. Potential Targets:
- The chart shows a potential price target of 4,870.90 INR, which represents a 21.02% move from the breakout point.
6. Overall Outlook:
- The breakout from the symmetrical triangle, accompanied by increased volume and strong RSI, suggests a bullish outlook for the stock.
- The next major resistance to watch would be the previous high around 4,400 INR.
