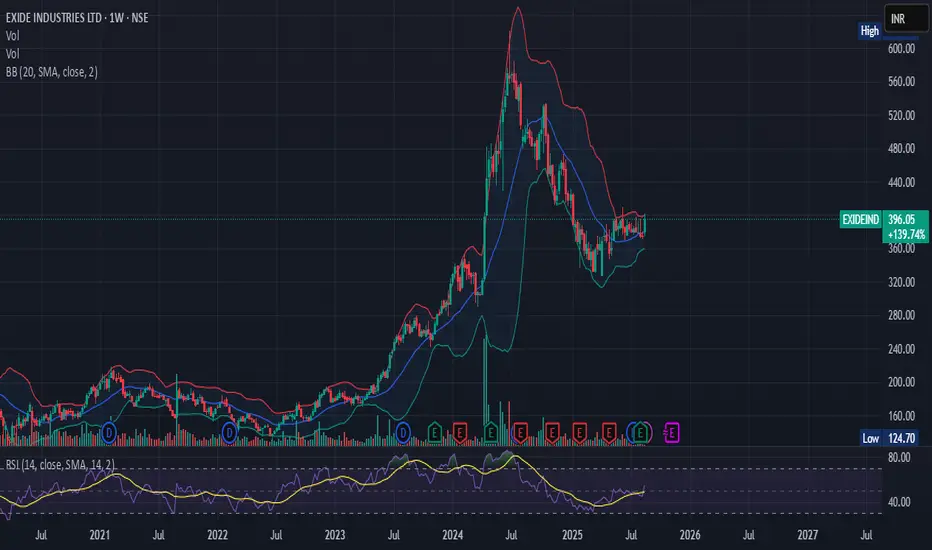
EXIDEIND 1 Month Time Frame 📊 1-Month Technical Overview
Price Performance:
Current Price: ₹393.15
1-Month Change: -5.73%
52-Week Range: ₹328.00 – ₹534.40
Technical Indicators:
RSI (14): 49.30 — Neutral
MACD: -1.72 — Buy Signal
ADX (14): 18.63 — Weak Trend
Pivot Points: Support at ₹385.58; Resistance at ₹409.28
Moving Averages:
5-Day EMA: ₹399.86 — Buy
20-Day EMA: ₹401.20 — Sell
50-Day EMA: ₹399.24 — Buy
100-Day EMA: ₹395.07 — Buy
200-Day EMA: ₹396.66 — Buy
Trade ideas
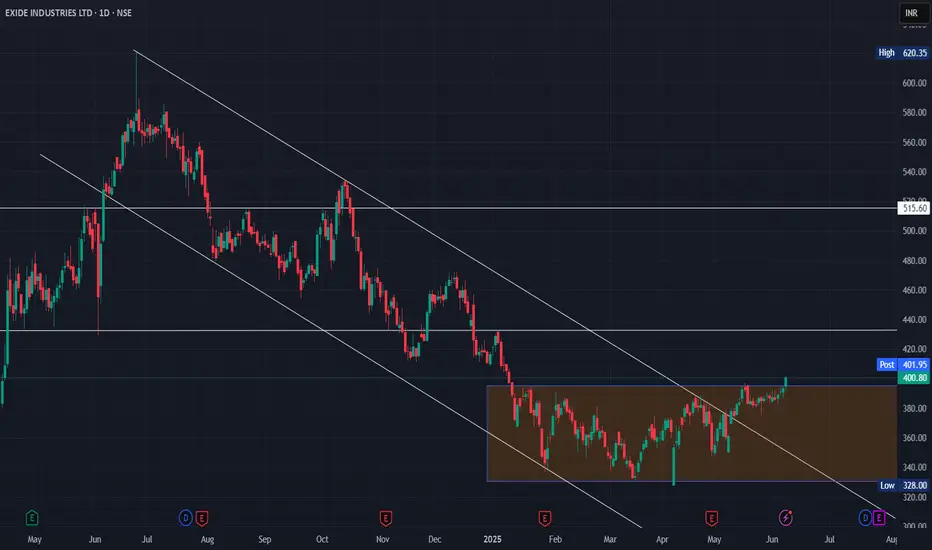
EXIDEIND: Strong Confluence of Support Signals Potential BullishTechnically we can say its reversal and BOSHello fellow traders,
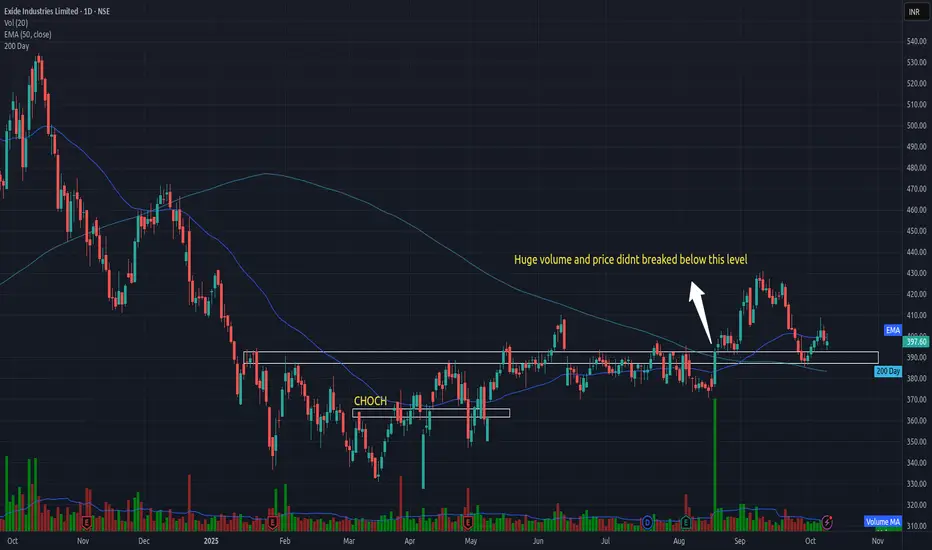
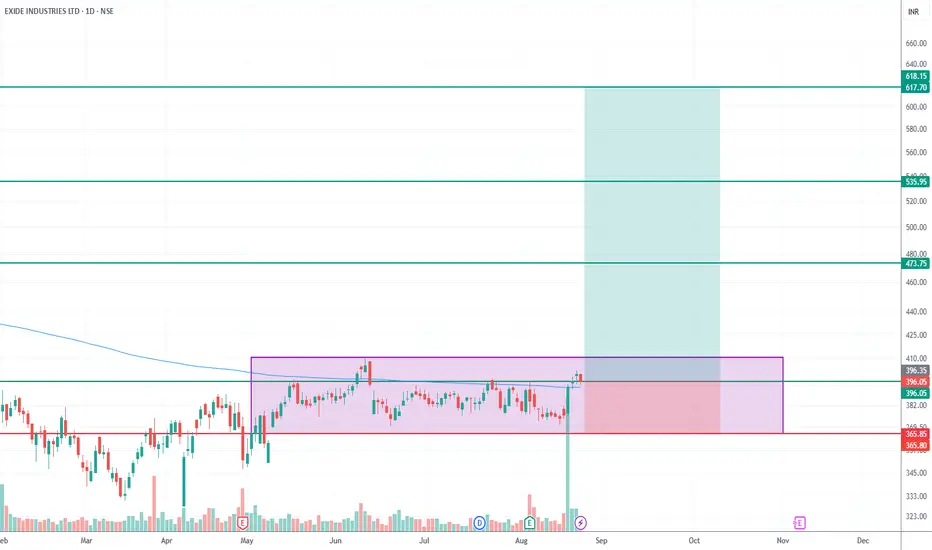
This is a technical analysis of Exide Industries (NSE:EXIDEIND) on the daily timeframe. After a significant rally in 2023-2024, the stock has been in a corrective phase. My analysis suggests that we are now at a critical support level that could signal the end of this correction and the beginning of a new bullish impulse.
Here are the key factors pointing towards a potential reversal at the ₹380 - ₹390 zone:
1. Horizontal Support & Resistance Flip:
The ₹380 level acted as a strong resistance zone from February to August 2025. The price has now pulled back to this level, and it appears to be acting as strong support. This is a classic "resistance-turned-support" pattern, which is often a reliable indicator of strength.
2. Fibonacci Retracement Confluence:
Drawing a Fibonacci retracement from the major low in January 2023 to the high in July 2024, we can see that the current price is finding support directly at the 0.5 to 0.6 Fibonacci level (approximately ₹379). This is a key area where buyers often step back in during a pullback.
3. Significant Volume Rejection:
As highlighted on the chart, in late August/early September, there was a massive spike in volume as the price tested this support zone. Despite the high volume, the price failed to break down, and instead, it was aggressively bought up. This indicates strong institutional interest and absorption of selling pressure, validating the strength of this support.
4. Moving Average Support:
The price is currently consolidating around the 200-day moving average (200 DMA), a critical long-term trend indicator. Holding above the 200 EMA is a strong sign that the long-term uptrend is still intact.
Potential Scenarios
🐂 Bullish Case: If the price continues to hold above this confluence of support (₹380-390), the next logical targets would be the recent swing highs around ₹430, followed by higher resistance levels.
📉 Bearish Invalidation: This bullish idea would be invalidated if we see a decisive daily close below the ₹370 level. A break below this would negate the support structure and suggest a further move to the downside, potentially towards the 0.618 Fibonacci level.
Conclusion: The combination of strong horizontal structure, a key Fibonacci level, high volume rejection, and the 200 DMA makes the current price level a high-probability zone for a bullish reversal.
Disclaimer: This is for educational purposes only and is not financial advice. Please do your own research before making any trading decisions.
Bullish Crossover Is Happen In Exide Industries Bullish Crossover Is Happen In Exide Industries Every retracement is Opportunity to Go Long Till Death Cross Over Or Price Is Inflate Stage

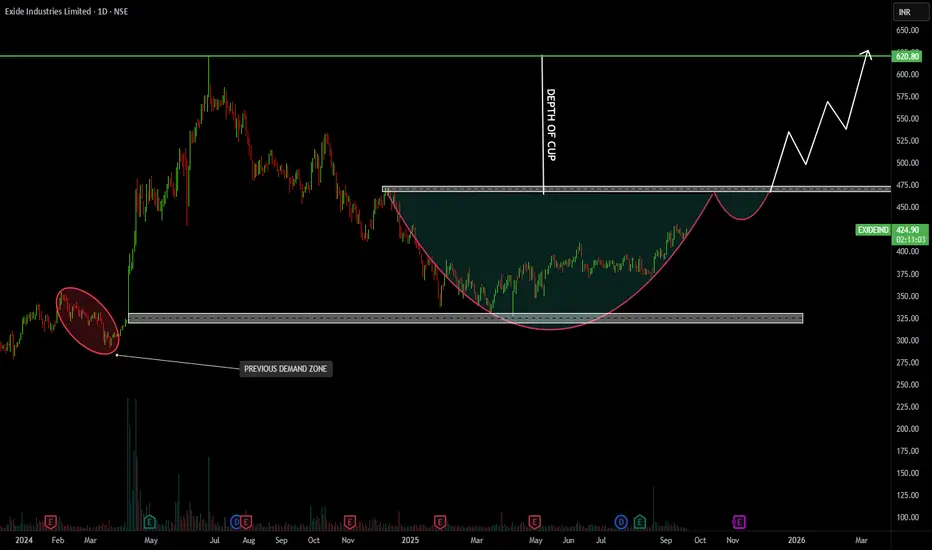
EXIDE INDUSTRIES LTDPrice has formed a Cup and Handle pattern, a classic continuation signal.
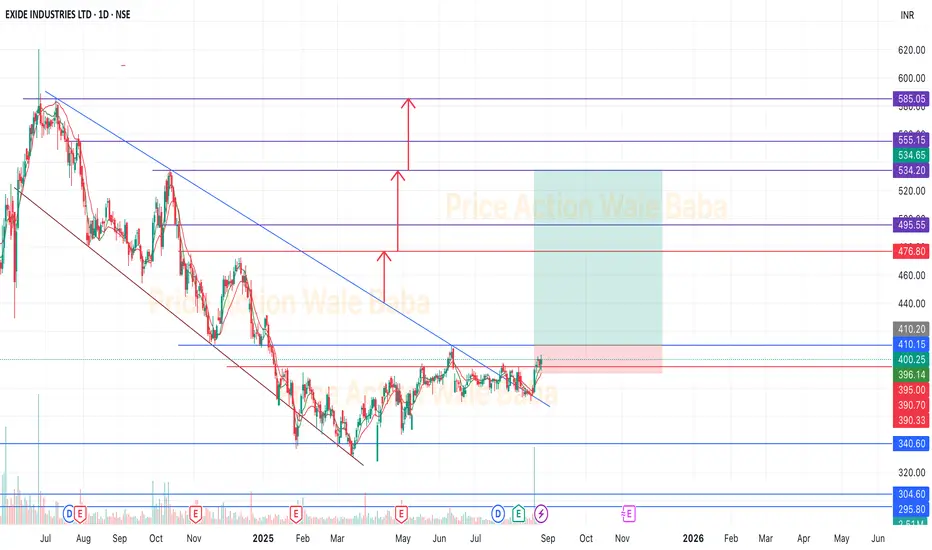
Breakout level is around ₹475, which if crossed, can trigger a strong rally.
Target zone after breakout is projected near ₹620.
Support lies around ₹350–370 (previous demand zone).
👉 In short: Bullish structure, breakout above ₹475 could open upside towards ₹620; strong base at ₹350.
Exide industries bullish Round Bottom in makingBuy Exide Industries
Buy at Price - 422
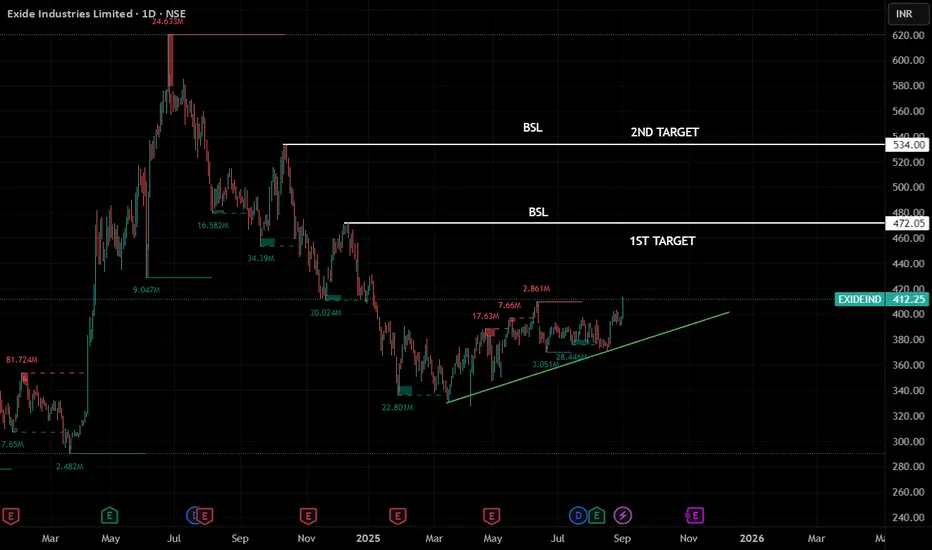
T1 - 472
T2 - 535
T3 - 620
Keep Stoploss at 369 Levels
Rational - Round bottom pattern to be completed
Please take note : To understand the risks involved in the securities market.
#Exide

Exide Industries Stock Breakout Sideways ZoneExide Industries Trade above 50 EMA
Stock Price has completed Elliott wave ABC correction.
A momentum is visible on the chart so we can make an entry here.
So we can make an entry here at 412 and our stop loss here will be 370 and the first target will be 472 and the second target will be 535.
Do your analysis before entering into the trade.

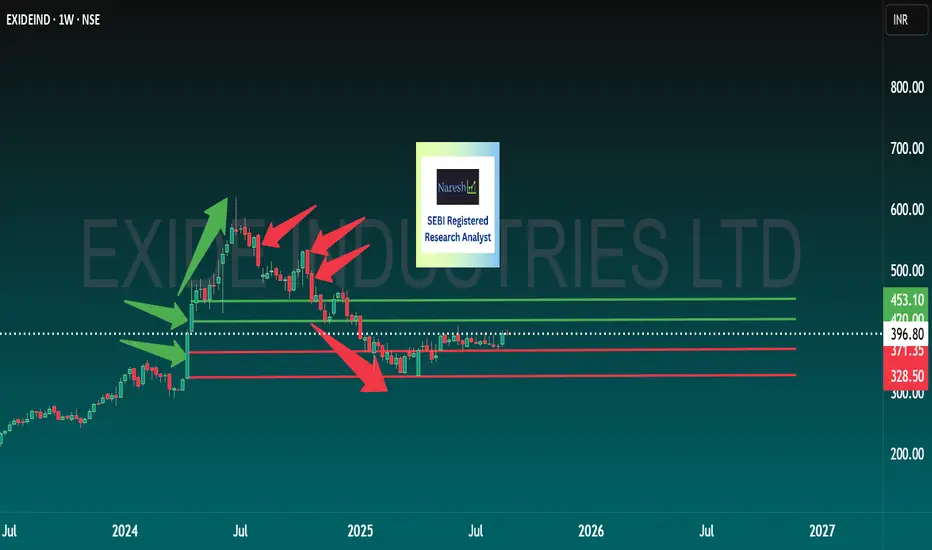
Exide NOT SO Exciting 🔎 Stock Analysis: EXIDE
➡️ Current Stance: Neutral — neither too strong, nor too weak.
➡️ Likely to remain range-bound until we see a strong breakout with heavy volumes on either side.
📊 Levels to Watch:
LTP: 396
Upside Resistance: 405–410 (difficult to sustain above this range)
If sustained above 410 → Upside possible till 440
Downside Support: 385
If sustained below 385 → Downside can extend towards 360 / 345
💬 Share your views in the comment box — Do you agree with this range outlook ?
📌 Stick to levels. Follow discipline. Let the trade work for you.
📌 Always use TSL to protect gains and maximize profits.
💡 If my analysis helped you, don’t forget to Boost 🚀 & Share!
💬 Comment below if you want me to analyse any stock for you 🔍
Warm regards,
Naresh G
SEBI Registered Research Analyst
Exide Industries – Ready for Breakout After Long Accumulation📈 Exide Industries – Ready for Breakout After Long Accumulation
Chart Pattern:
Stock has been consolidating in an accumulation phase after forming a Bullish Order Block around ₹320–340.
A cup-shaped structure has developed with higher lows, indicating strong demand absorption.
Price has now broken out above the falling trendline resistance and is trading around ₹412.
Key Levels to Watch:
Immediate Support: ₹387–400 zone (previous resistance, now support).
Resistance 1: ₹455–465
Resistance 2: ₹515–525
Resistance 3 / Target Zone: ₹575–585
All-Time High: ₹620+
Trade Setup Idea:
✅ Entry Zone: ₹400–415 (on dips or sustaining above breakout).
🎯 Targets:
₹460 (Resistance 1)
₹520 (Resistance 2)
₹580 (Resistance 3)
🛡️ Stop Loss: Below ₹385 (closing basis).
Technical Confluence:
Breakout from multi-month trendline.
Strong accumulation visible in volumes.
Cup & handle–like formation suggesting momentum build-up.
⚡ View: Medium-term bullish. A breakout above ₹460 can open the gates for higher targets up to ₹580–600 .

Exide Industries Ltd (EXIDEIND) – Breakout MomentumPrice Action
CMP: ₹396–400 (Aug 29, 2025)
Stock is consolidating near highs after strong rally.
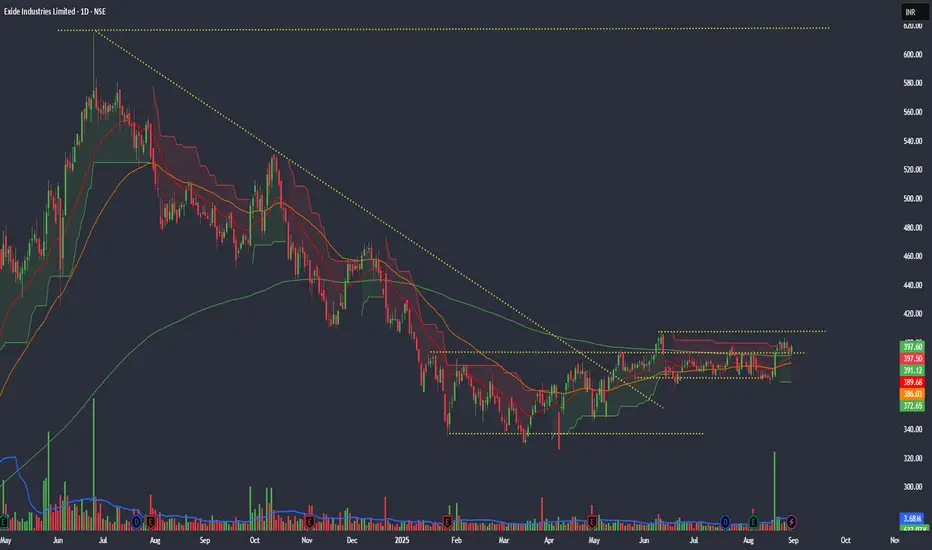
Trading above 20 / 50 / 200 EMAs → confirms bullish structure.
Resistance: ₹405–410 (breakout zone)
Support: ₹389 → ₹385 → ₹365 (weekly base)
Upside Targets:
🎯 T1 = ₹430
🎯 T2 = ₹475
🎯 T3 = ₹535 (extended swing target)
Invalidation: Close below ₹385 → caution; below ₹365 → setup weakens.
Indicators & Momentum
RSI (14): ~62 → bullish, not extreme yet.
ADX: Strength building → supports continuation.
MFI: Above 70 → strong money inflow, but watch overbought.
MACD: Mixed; short-term pauses possible.
🧭 Trading View Bias
Bias: Bullish above ₹389
Short-Term: ₹405 → ₹430
Medium-Term: ₹475 → ₹535
Caution: Sustained close below ₹385 shifts bias neutral.
Disclaimer: This is a technical analysis for educational purposes only—not financial advice. Always perform your own due diligence before trading.
ExideExide is near breakout.
Looks good to buy on dip. In short term, it can give the good returns.
Company under power sector and making batteries for two and four wheeler. So, diwali sales can grow and give good result.
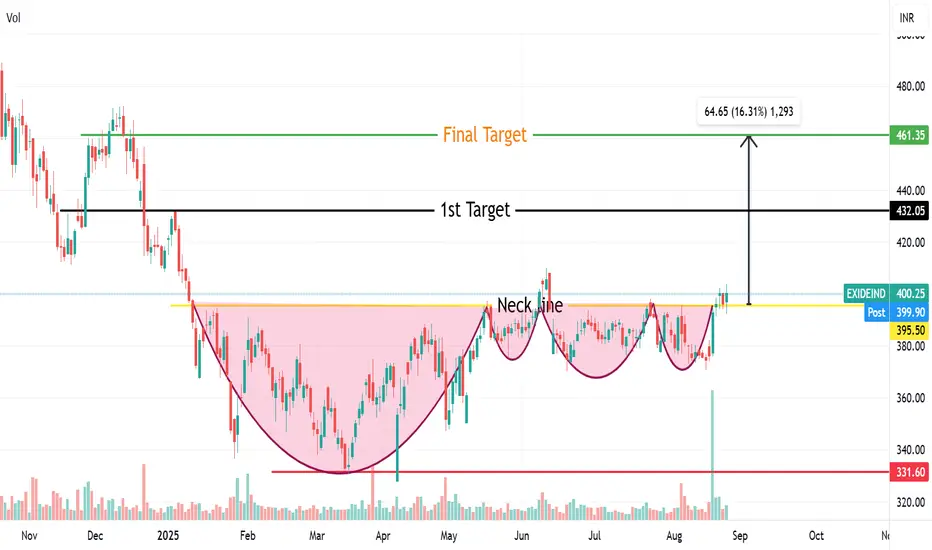
Complex Cup & Handle pattern breakout in Exide Exide given breakout of Complex Cup & handle Pattern from neckline of 400 level .Final target of it will be 460 level & Near term target will be 430 level with a stoploss of 360 Rs.
its not a buy or sell call ..just for education
Near break outResults was good hole auto pack performed well week gone buy, now its time for Exide we are seeing target around 430,450 in short to medium term with the stop loss at 370.
Exide Industries – Weekly Consolidation Breakout SetupDisclaimer: This analysis is for educational purposes only. I am not a SEBI-registered advisor. Please consult your financial advisor before making investment decisions.
🔎 Weekly Chart Observation
From May 12th to August, the stock consolidated between ₹365 (support) and ₹410 (resistance).
Recently, a strong bullish candle has formed on the weekly timeframe, hinting at a possible breakout.
Consolidation range: Low = 365 | High = 410.
📈 Daily Chart Confirmation
On the daily timeframe, the price has broken above the 200 EMA, showing strong momentum.
CMP: ₹396.
Stop Loss (Closing Basis): ₹365 (consolidation low).
🎯 Targets
Target 1: ₹475
Target 2: ₹535
Target 3: ₹618 (extended target, top of consolidation projection)
⚖️ Risk-Reward
Entry: ₹396
Stop Loss: ₹365
Risk–Reward Ratio ≈ 1:7.25 (for second target ₹535).
📌 Summary:
Exide Industries is exhibiting a strong weekly breakout from consolidation, supported by a daily breakout of the 200 EMA. The setup presents an excellent risk-reward opportunity, with clear targets and a well-defined stop-loss.
EXIDE INDUSTRIES LIMITEDExide Industries is showing a strong uptrend structure, with the stock consistently holding above its long-term moving averages, which reflects sustained institutional interest. After a healthy consolidation phase near its recent support, the price has started to rebound, signaling that buyers are actively defending lower levels.
On the technical front, the breakout candle formed above the consolidation range is supported by rising volumes, suggesting accumulation and strength behind the move. Momentum indicators like the RSI are trending upwards, confirming a pickup in bullish sentiment, while MACD is indicating a fresh crossover that typically precedes a continuation of the uptrend.
The stock has also respected its demand zone, and the recent higher low formation points towards continuation of the larger bullish trend. With a clearly defined stop-loss below the immediate support and an attractive risk-to-reward setup, Exide Industries presents a compelling buy opportunity for both swing traders and positional investors.
Exide IND seems to give breakout and move ahead.Exide IND IS MOVING AHEAD after a breakout.
IF IT sustains this breakout it will march ahead
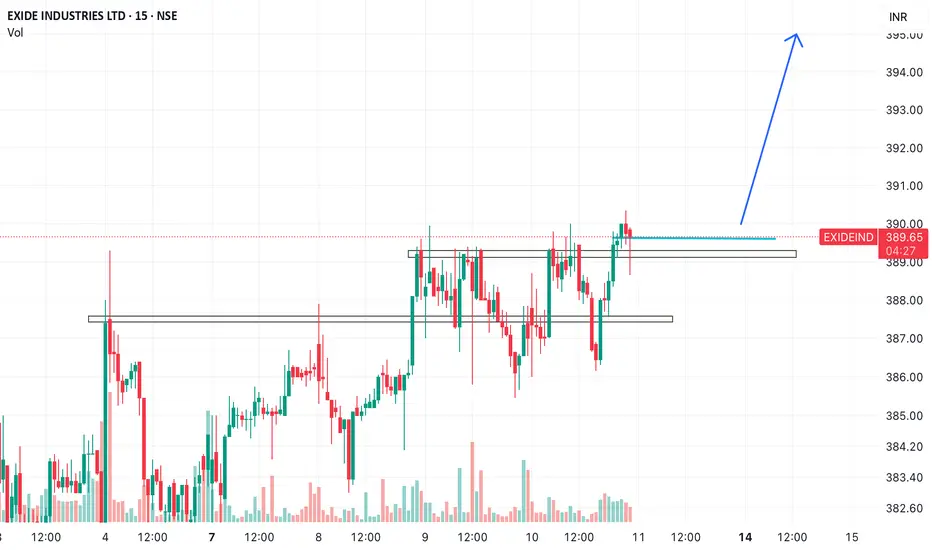
Batteries Charged. Breakout Imminent. Exide is the Trade
“This is not about hoping. This is about reading what the market is already telling you — and acting with conviction.”
Why Exide Looks Solid Now
1. Clear Horizontal Resistance Break (₹389–390 Zone):
The stock has tested this level multiple times over the past sessions. Each rejection has been weaker than the last. Today’s close near the highs with a tight-bodied candle indicates absorption and intent to push through.
2. Ascending Triangle Formation:
Higher lows with flat resistance — a classic bullish continuation structure. This is a textbook setup where demand is building and supply is getting exhausted.
3. Volume Confirmation:
On each approach to ₹390, volume has picked up. This is not a passive drift-up; it’s active participation from serious hands.
4. Sectoral Tailwind:
Battery and auto-ancillary stocks are attracting quiet inflows. Smart money rotates before headlines. Exide is showing those early signs — tight range, clean structure, and low volatility before a move.
5. Risk-Reward is Skewed in Favor of the Trade:
You’re risking very little for a move that can happen quickly once ₹390 breaks on strength.
⸻
Trade Setup
• Buy Above: ₹389.50–₹390
• Stop Loss: ₹386.90
• Target 1: ₹393.50
• Target 2: ₹396–397
• Holding Period: 1 to 2 days
• Risk-Reward Ratio: 2.5 to 3x
⸻
Bottom Line
This is a simple, well-defined trade with price structure, volume, and risk control all working in your favor. It is not speculative, it is tactical.
“You make money in markets by participating in strong structures when others are waiting for confirmation. This is one of those moments.”
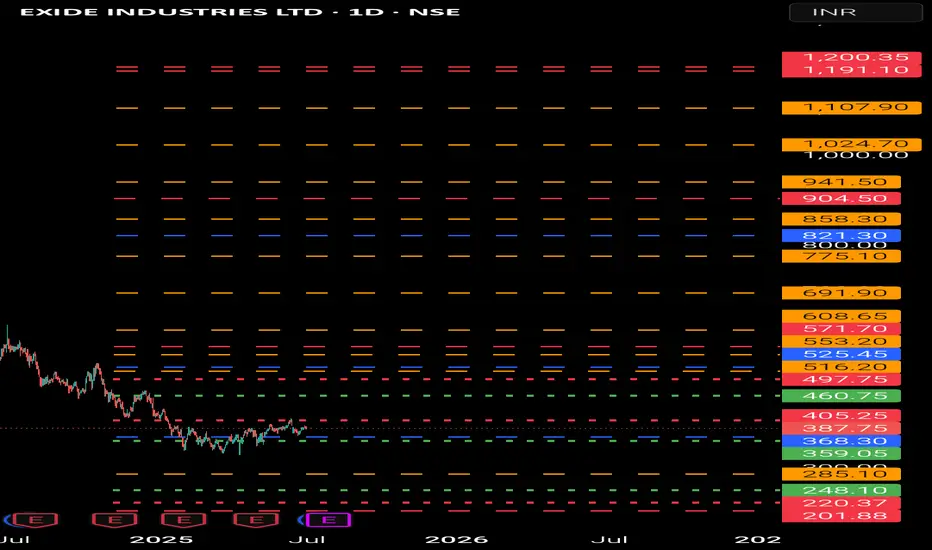
EXIDEIND (Exide Industries Ltd)- Analysis Bullish Levels -if sustain above 460 (early entry risky) then 497 to 525 (safe entry if sustain above this for a week) target can be around 571 first target, then 822 if sustain above for a week or two then we expect more upside and wait for targets around 858 to 904 if sustains above for for week or two then hold for long term tragets 1191 to 1200 above this more bullish
Bearish levels :- if sustain below 405 then 359 swing trade exit below this if sustains for 2-3 days then if comes to this levels 285 to 248 good support with SL of 220 or 200 for long term investors below this more bearish.
**Consider some Points buffer in above levels
**Disclaimer -
I am not a SEBI registered analyst or advisor. I does not represent or endorse the accuracy or reliability of any information, conversation, or content. Stock trading is inherently risky and the users agree to assume complete and full responsibility for the outcomes of all trading decisions that they make, including but not limited to loss of capital. None of these communications should be construed as an offer to buy or sell securities, nor advice to do so. The users understands and acknowledges that there is a very high risk involved in trading securities. By using this information, the user agrees that use of this information is entirely at their own risk.
Thank you.
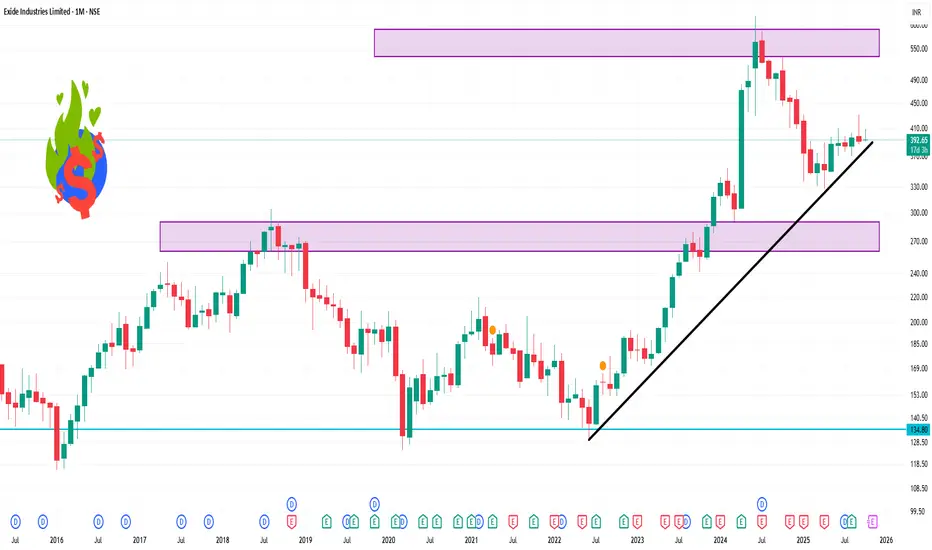
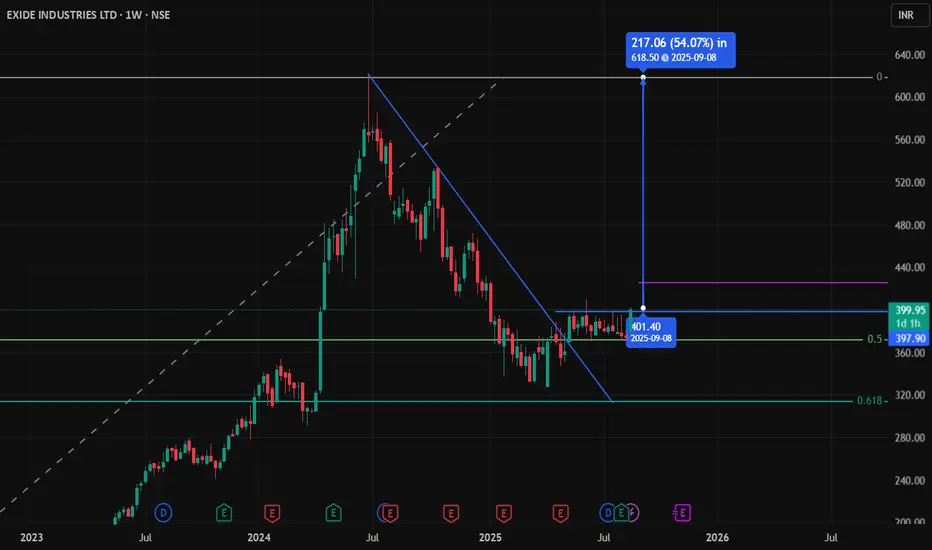
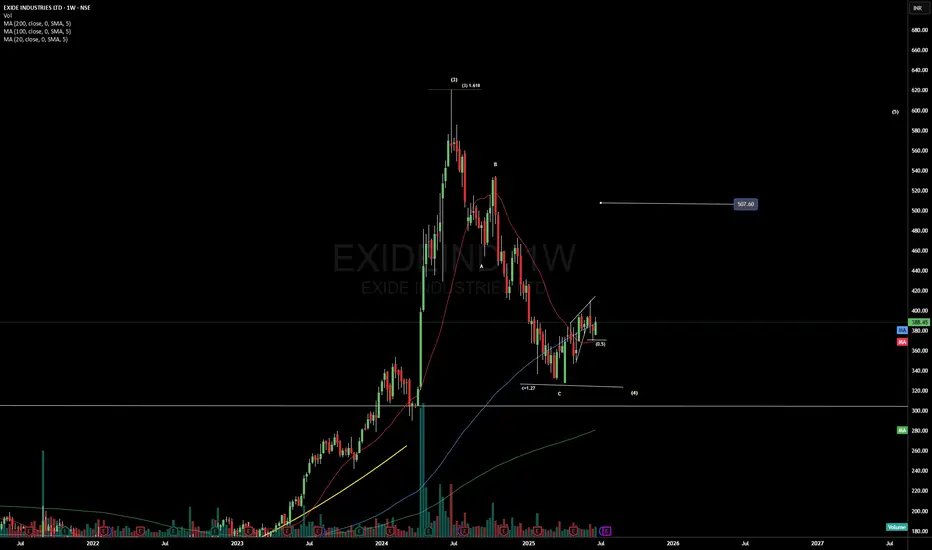
After steep correction - reversing with a leading diagonal Exide earlier formed a nice rounding bottom and moved to 600 levels which completed its up move and then completed the deep corrective move with a zigzag pattern at around 320, re-testing the neck of the rounded bottom / cup.
Currently it formed a leading diagonal (wave 1 or wave A) which indicates a good rally is in the offing. CMP is 388. Even wave 2 (B) also is done at 0.5 levels. This weeks candle closed above the hammer candle confirming the reversal and indicating that the rally is to continue.
Details below:
Though the 600 levels appear to be wave 3 and the correction expected was of wave 4. But such steep a correction is not expected in wave 4, especially after wave 2 corrected to 0.618 levels.
So I see 2 possibilities -
1. The 600 was wave 1 on a primary level and this current correction that corrected to almost 0.5 levels, could be wave 2. In that case we will be getting the next wave 3 which will take it to ATH and beyond.
2. The current correction is wave 4.
(a) - The correction of a zigzag got completed at around 320 levels, and its wave 5 in the making - in which case the min target is around 500 - even with a 5th wave failure.
(b) - The correction might continue to form a flat correction in which case too it has to touch 500 levels (0.618 of the zigzag for the B wave of flat).
So the tentative minimum levels expected is 500. And further clarity will emerge with its progress.
Disclaimer:
1. Not a trade recommendation but an analysis for learning.
2. I do not own this stock in my portfolio as of now.
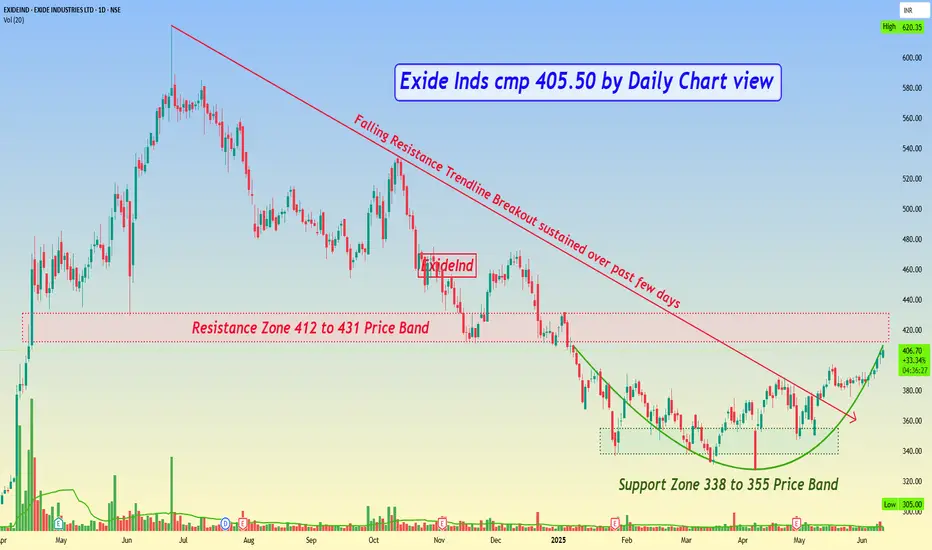
Exide Inds cmp 405.50 by Daily Chart viewExide Inds cmp 405.50 by Daily Chart view
- Support Zone 338 to 355 Price Band
- Resistance Zone 412 to 431 Price Band
- Falling Resistance Trendline Breakout sustained over past few days
- Bullish Rounding Bottom pattern done with Resistance Zone neckline hurdle
- Volumes in close sync with avg traded quantity over past few days with intermittent spikes
[EXIDEIND] Chart AnalysisHi there, EXIDE INDUSTRIES is looking good for next couple of weeks/months.
Note: Please ask your financial advisor before investing. (This post is only for educational purpose)
EXIDE INDUSTRIES LTDAs of May 30, 2025, here are the monthly support and resistance levels for Exide Industries Ltd (NSE: EXIDEIND) based on various technical analysis methods:
📊 Current Price Snapshot
Last Traded Price: ₹386.85
Day’s Range: ₹383.15 – ₹390.20
52-Week Range: ₹328.00 – ₹620.35
Volume: 1,888,195 shares
VWAP: ₹386.58
Market Capitalization: ₹32,882 crore
Beta: 1.37
Dividend Yield: 0.52%
Book Value per Share: ₹162.65
Upper Circuit Limit: ₹427.65
Lower Circuit Limit: ₹349.95
Face Value: ₹1.00
🔧 Monthly Support & Resistance Levels
Standard Pivot Points
Pivot Point: ₹384.23
Resistance Levels:
R1: ₹416.72
R2: ₹444.83
Support Levels:
S1: ₹356.12
S2: ₹323.63
Fibonacci Pivot Points
Pivot Point: ₹356.12
Resistance Levels:
R1: ₹379.27
R2: ₹393.57
R3: ₹416.72
Support Levels:
S1: ₹332.97
S2: ₹318.67
S3: ₹295.52
Camarilla Pivot Points
Pivot Point: ₹356.12
Resistance Levels:
R1: ₹357.31
R2: ₹362.86
R3: ₹368.42
R4: ₹385.08
Support Levels:
S1: ₹346.19
S2: ₹340.64
S3: ₹335.08
S4: ₹318.42
📈 Technical Indicators Summary
Relative Strength Index (RSI): 55.32 (Neutral)
MACD: 0.333 (Bullish)
ADX: 16.63 (Indicates a weak trend)
Stochastic RSI: 55.28 (Neutral)
Supertrend: ₹384.44 (Bullish)
Parabolic SAR (PSAR): ₹385.89 (Bullish)
🧭 Trading Outlook
Trend: Neutral to Slightly Bullish
Recommendation: The stock is trading near its monthly pivot point, indicating a neutral stance. Traders should monitor for a breakout above R1 (₹416.72) for bullish confirmation or a breakdown below S1 (₹356.12) for bearish signals.

EXIDE ready to give 10% upsideCUP formation in W and in the process of completion.
Taken MA supports.
RSI divergence indicating trend is gradually turning positive.
SL at 365 with target of 425.
