Long viewCup and handle breakout and retest confirmed.
Going for 5 year high breakout. Wait for retest before trade and trend continuation.
Caution: For education Purpose only.
Trade ideas


Amazing breakout on Weekly / Daily Timeframe - EXIDEINDCheckout an amazing breakout happened in the stock in Weekly timeframe, macroscopically seen in Daily timeframe. Having a great favour that the stock might be bullish expecting a staggering returns of minimum 25% TGT. IMPORTANT BREAKOUT LEVELS ARE ALWAYS RESPEECTED!
NOTE for learners: Place the breakout levels as per the chart shared and track it yourself to get amazed!!

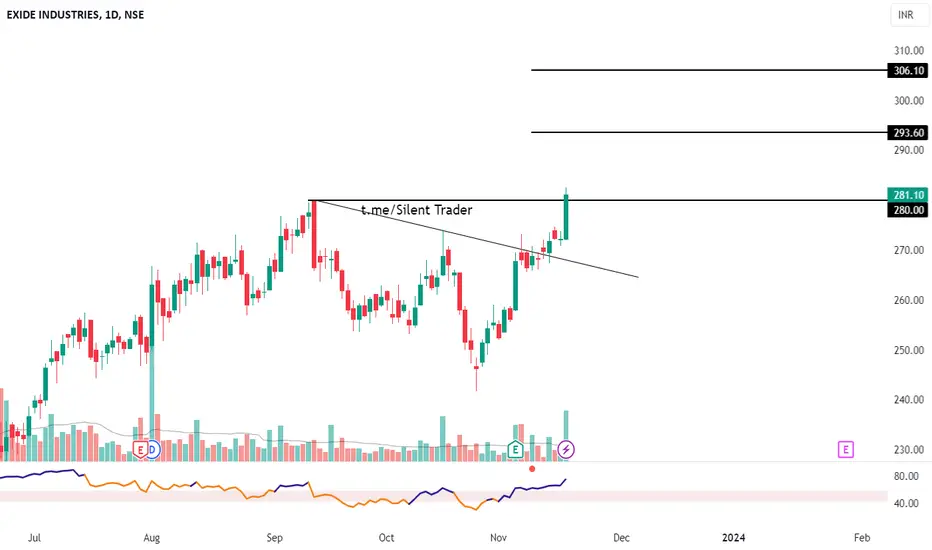
Exide Industries Ltd - Rally will continue #EXIDEIND
CMP - ₹.282
Leading manufacturers & traders of acid storage battery have operations all over the world. An undervalued company with good balance sheet and proven track record. Revenue and net profit increasing on QoQ. But net cash flow is negative. Stock is trading at its 52 week high now. Have strong resistance at 300-310 levels and support at 260-270 levels. Technically looking good at this point with an upward movement towards 500 .
Disclaimer : Post only for educational purpose. Not a buying / selling recommendation. This is only my personal view. I am not a SEBI registered analyst . Do your own analysis and act accordingly .

EXIDEIND Bullish; above 282 on Monday 20 Nov. The above information does not constitute investment/trading recommendation and it is purely for educational purpose. Please check the Strategy below...
SWING Trading Strategy:
Position is created, only upon stock closing above the entry price on day closing basis and is held on for 5-10 trading sessions for larger gains (5-10%)
INTRADAY Trading Strategy:
1) Impulse upmove stage: The strong upmove (nearly upto 2% from breakoutprice) happens within five to 15 minutes. "High Risk Traders" buys in hope of another 2% upmove intraday.
"High Risk Traders" may have to patiently wait through the Pullback-Consolidation stage to realize profits. High risk/High reward set up as breakouts may fakeout (reversal)also
2) Pullback-Consolidation stage: After the above "Impulse upmove stage"; the price may then pull back and move sideways (between "Open" price and "High" of the above "Impulse upmove stage").
Safe traders with minimum risk profile may Wait for a breakout from the consolidation to enter at this stage to relize high profits in the final intraday final "Breakout continuation" stage
3) Breakout continuation: Stocks often in the third stage breaks up above the "High" of the first "Impulse upmove stage" and continue to go higher again.
Both Safe Traders/High Risk Traders book profits at this stage
Stop Loss: @ "Open" price of the day OR "Breakoutprice"
This do not constitute, financial, investment, trading, or other types of advice or recommendation.

EXIDE multi year breakout Exide looking for the multiyear breakout from this level and tgt is open for higher end

Exide Breakout One confirmation require for breakout confirmation trade, Retest breakout level is the ideal one to decide for long
Exide Ind : Parallel Channel Breakout#Exideind #channelbreakout #breakout
Exide Industries : Swing Trade / Short Term Trade (1-3 Months)
>> Parallel Channel Breakout
>> Good Trending setup
>> Good Volumes & Strength in stock
>> Low Risk High Reward Trade
>> Potential Upside of 10% or more
Swing Traders can lock 10% profit & keep trailing
Please Like or comment if u r Liking the analysis & Learning from it. Keep showing ur Love
Disclaimer : This is not a Trade Recommendations & Charts/Stocks Mentioned are for Learning/Educational Purpose. Do your Own Analysis before Taking positions.

Now the Battery is fully chargedA Weekly Bullish Flag and Pole pattern is visible on the charts of NSE:EXIDEIND
Flag and Pole pattern is a bullish continuation pattern and it is visible in charts after a meaningful appreciation in the NSE:EXIDEIND
MACD gave Positive crossover on Daily chart and Monthly chart and weekly chart, it is moving towards the positive territory. So, expecting the momentum to continue.
One can look to create a fresh position in the scrip near Rs. 261-268 levels with the stoploss of Rs. 240.90 on weekly closing basis. The 1st target will be 285.10 , 2nd target will be 300.10, 3rd target will be 316.20, 4th target will be 335.65 and fifth target will be 348.55.
This study is for educational purpose only.

BREAKOUT, EXIDE INDS, 50% RETURNS!!!BUY - EXIDE INDUSTRIES
CMP - Rs. 267
Target - 1: Rs. 330
Target - 2: Rs. 395
.
Timeframe - 4 - 10 months
.
Technicals - Trendline Breakout
.
This is just a view by an expert analyst, please invest at your own risk.
.
Follow me for more!

EXIDE SHORT TRADEIt is clearly noticeable that Exide Ltd. has changed character from bullish to Bearish and the order flow of this stock is also now bearish.
The price has retraced back to 70-80% Discount area as ascertained from Fibonacci tool and coupled with a strong order block which initiated the previous downfall leaving behind a huge impulse, it gives us further confirmation for the short side bias.
Price has approached the order block and is facing resistance also from the trendline above (marked in yellow).
I will take the leg of the previous downfall and ascertain my next target as shown in the figure.

Exide Bearish Order flowAs we can notice clearly that Exide Ltd. has changed character from bullish to Bearish.
The order flow of this stock is now bearish.
The price has retraced back to 70-80% Discount area as ascertained from Fibonacci tool and coupled with a strong order block which initiated the previous downfall leaving behind a huge impulse, it gives us further confirmation for the short side bias. Price has approached the order block and is facing resistance also from the trendline above (marked in yellow).
I will take the leg of the previous downfall and ascertain my next target as shown in the figure.

BuyBuy in dip around 245 -235 -225 stop loss 210 daily closing target 320 and 350 . Time frame 6 months
Disc : it's not an investment advise to buy or sell


📈 Exciting Bullish Pattern Alert! 🐂📈 Exciting Bullish Pattern Alert! 🐂
📊 Pattern: Broadning Pattern
📌 Symbol/Asset: EXIDEIND
🔍 Description: Stock is forming broadning pattern and around 255 there are multiple supports are coming.
👉 Disclosure: We are not SEBI registered analysts, this is not a buy or sell recommendation. Technical patterns are just one piece of the puzzle. Consider conducting further research, consulting with a financial advisor, and managing your risks appropriately.

EXIDE IND 1HRINTRADAY / SWING TRADE
EXIDE IND Looking good for upside..
When it break level 272and sustain.. it will go upside...
BUY@ 272
Target
1st 276
2nd 279
MPHASIS SEP FUT – 6 LOT (Qty-21600)
MINIMUM 10L CAPITAL
Enjoy trading traders.. Keep add this STOCK in your watch list..
Investor are welcome..
TRADERS HOLD SWING TRADE FOR LONG TARGET

Exide Industries longExide industries looking good for breakout...
at current scenario it should get back to 188 or trendline for retest.
Please do your own analysis before taking any positions.


A Perfect Buying setup in Exide IndustriesStock has recently given a breakup and then consolidated for few days with volume drying up. Last close was above the high of breakout candle with increased volumes.
Disclaimer - Only for study purpose - Trade at your own risk


Exide Industries Ltd - Long Setup, Move is ON...#EXIDEIND trading above Resistance of 235
Next Resistance is at 266
Support is at 193
Here is previous chart:
Chart is self explanatory. Entry, Resistances and Support are mentioned on the chart.
Disclaimer: This is for demonstration and educational purpose only. This is not buying or selling recommendations. I am not SEBI registered. Please consult your financial advisor before taking any trade.

Short exide industries - target 250Over bought condition on daily and weekly time frames. Auto sector headed for correction. Short for targets 250, 240 and possibly more in 1-2 months

Bearish Bat Harmonics In EXIDE Bearish Bat Harmonics In Exide
Sell PRZ - 285/289
SL - 305 ( Weekly Closing Basis )
Target - 252/229/210
