BUY TODAY SELL TOMORROW for 5%DON’T HAVE TIME TO MANAGE YOUR TRADES?
- Take BTST trades at 3:25 pm every day
- Try to exit by taking 4-7% profit of each trade
- SL can also be maintained as closing below the low of the breakout candle
Now, why do I prefer BTST over swing trades? The primary reason is that I have observed that 90% of the stocks give most of the movement in just 1-2 days and the rest of the time they either consolidate or fall
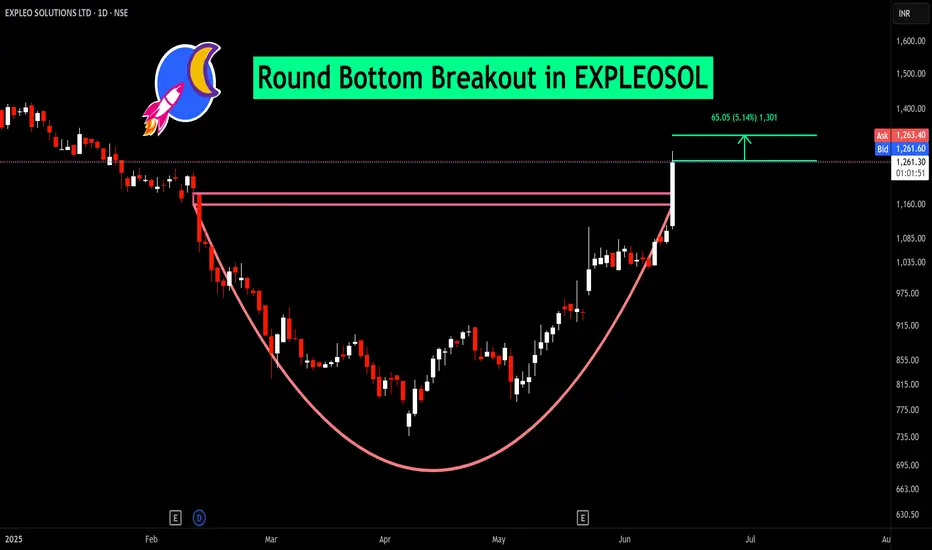
Round bottom Breakout in EXPLEOSOL
BUY TODAY SELL TOMORROW for 5%
Expleo Solutions Limited
No trades
Market insights
EXPLEO SOLUTIONSCMP: ₹1204
Promoter Confidence: A significant 15% increase in promoter holding between March 2023 and June 2023, signaling strong belief in the company's prospects.
Technical Analysis: A strong rounding bottom pattern, formed over the long-term since 2015, indicates a bullish breakout potential.
Solid Foundation: The stock has built a stable base over the past 4 years, providing a strong platform for future growth.
Financial Strength: Backed by robust financial performance, adding credibility to its growth story.
Target: ₹2400 (1-year horizon).

Expleo SolutionsTechnical Analysis of Expleo Solutions:
Expleo Solutions' price has been range-bound for over two years, specifically 847 days. The peak it reached between May 2023 and August 2023 is considered an outlier, as the stock has since reverted to its prior trading range.
Despite this, the stock has experienced a notable 55% increase in trading volume, from 6.2 million shares to 9.6 million over the last 470 days. This increase is significant when compared to the previous 470-day period. The MACD also suggests a decline in seller interest, indicating potential shifts in momentum that could lead to a more positive outlook.
Two key support and resistance levels have been identified, which will be pivotal in determining future price movements.
Potential Risk:
The primary risk to the stock's upward trajectory is the possibility of a broader market correction, particularly influenced by uncertainty in the Index and geopolitical tensions.
Disclaimer:
This analysis is intended for educational purposes and is not a purchase recommendation. It is important to learn how to recognize and understand patterns in stock movements.

SwingPrice Trend:
The stock has been in a consolidation phase in recent years after recovering sharply from the COVID-19 crash in 2020.
There is a noticeable breakout attempt above a key resistance trendline (orange line), indicating bullish momentum.
Resistance Levels:
The horizontal line at ₹1,350 represents a critical resistance zone. This level appears to have been tested multiple times over the past few years and has now been breached.
Breakout Confirmation:
The weekly candle has closed above the resistance line, indicating a possible breakout.
The breakout suggests that the stock might rally higher, targeting the next projected level of approximately ₹1,850 (a 37% potential upside).
Volume:
The trading volume for the breakout week is relatively stable, though significant spikes in volume would further validate the breakout strength.
200 EMA Perspective:
If included, the stock's 200 EMA (Exponential Moving Average) might be acting as support below current levels, providing bullish sentiment.
Conclusion
This chart hints at a potential bullish breakout from long-term resistance. If market sentiment supports this move, the stock could continue its upward trajectory. However, traders should keep an eye on the volume and watch for sustained closes above ₹1,350 to confirm the breakout.

EXPLEOSOLEXPLEOSOL
Expleo Solutions Ltd
CMP 1376
Currently at resistance zone. above 1390 can go long

Trendline Breakout after consolidationPrice breaking trendline after consolidation, Now forming higher high and the good point is price taking support at 2024 opening price line. As I said (yearly opening) taking support / resistance.
Same as my previous trade of CENTENKA.

EXPLEOSOL looks great as per current position Expleo Solutions Ltd is an India-based software service provider primarily delivering software validation and verification services to the BFSI industry worldwide
Near All TIme High Breakout and retracement zone.
ROE 3Yr % = 54
Sales Var 3Yrs % = 44
ROCE 3Yr % = 33
PE = 09
What else is required, at great valuation and a great growth.

EXPLEOSOL | Swing Trade📊 DETAILS
Sector: IT Services & Consulting
Mkt Cap: 2,293 cr
Expleo Solutions Ltd is an India-based software service provider primarily delivering software validation and verification services to the BFSI industry worldwide.
TTM PE : 23.24 (Average PE)
Sector PE : 37.59
Beta : 0.78
📚 INSIGHTS
Mid-range performer
Stock with medium financial performance with average price momentum and valuation. These stocks may be affordable and are showing some investors interest.
16.84% away from 52 week high
Outperformer - Expleo Solutions up by 4.41% v/s NIFTY 50 up by 0.95% in last 1 month
📈 FINANCIALS
Piotroski Score of 4/9 indicates Weak Financials
Disclaimer: This analysis is for educational purposes only, and I'm not a SEBI registered analyst.
If you found this analysis helpful, I encourage you to like and share it. Your observations and comments are also welcomed below. Your support, likes, follows, and comments motivate me to consistently share valuable insights with you.
🔍 More Analysis & Trade Setups 🔍
For more technical analysis and trade setups, make sure to follow me on TradingView: www.tradingview.com

Expleo Solutions Long Term (Buy at 1418.85 SL 1250 Targets 1800+This candle shows a good reversal sign on the overall trend of the stock
The stock has formed a cup and made a deep handle and looks ripe for a bounce
Fundamentally a very very strong company with revenues from all over the world
This can be bought at the CMP of 1418.85 using a strong stoploss of 1250
The first target can be the completion of the cup at 1800 and breaking out from there can take the stock to levels of 2400/2600
Should be trailed occasionally and profit booking is necessary on every 30% gains

Expleo Solutions Bottomed outExpleo Solutions is bottomed out strict SL 1294 closing basis with target 2200 in a year time frame, its a weekly time frame

Expleo Solutions: Trading near midpoint of range consolidationExpleo Solutions is trading near midpoint of range consolidation on weekly time frame. On daily time frame stock is forming double bottom pattern. Keep on radar for low risk opportunity.

Big opportunity in Expleo Solutions.Hello Guys I hope you are doing well. Here I bring the complete analysis of EXPLEO SOLUTIONS.
Please Go through all analysis which I have presented to you in a very easy to understand language.
Fundamental Analysis: Expleo Solutions
1. About the Company:
>>Fast-growing software company, especially with banks.
>>Small-cap but growing steadily.
2. Financial Strength:
>>Almost no debt, a good sign.
>>Profits increasing by around 33% annually over 5 years.
3. Profitability:
>>Good at making money, with an average of 26.8% profit on what it owns.
4. Ownership Changes:
>>Founders have increased their ownership by about 14.9% recently.
Foreign investors are also buying more shares.
5. Future Expectations:
>>Predicted to have a strong quarter ahead.
>>In summary, Expleo Solutions is financially healthy, profitable, and with increasing interest from its owners and investors, it's looking forward to a positive upcoming quarter.
Technical Analysis:
1. Current Trend and Patterns:
>>In the Daily timeframe, the stock is moving sideways.
>>Initially, it formed a descending triangle pattern and broke out, but later retraced and created a "double bottom" indicating W shape recovery.
>>We can also find an another pattern called Ascending Parallel channel pattern, connecting to the previous triangle pattern.
>>Presently, the stock appears to be consolidating within this parallel channel pattern.
2. Price Reaction and Support:
>>After Q1 earnings, the stock experienced a sharp 25% decline, reaching its support level.
>>This significant drop could be due to resistance acting as a barrier.
>>Despite the fall, sales and profit ratios indicate stability.
3. Current Situation and Momentum:
>>The stock is currently available at a discounted level.
>>Over the past 4 days, it has shown consistent upward movement.
>>Positive RSI levels suggest favorable momentum.
4. Consideration for Entry:
>>Considering the recent positive movement and RSI indications, entering the stock could be considered.
>>Place a logical stop loss at 10% to manage risk.
>>The potential target is a 25% profit.
5. Buying at Support vs. Breakout:
>>Purchasing at the support level is safer compared to buying at breakout points.
>>Although it might take longer to see gains, it reduces the risk associated with breakout trading.
Do consider pressing the boost button🚀🚀, It helps me bring more interesting analysis. And if you've any question and suggestion please feel free to post in comment section.
Note: This is for informational purposes only. Do your own research before investing.

ExpleoSolution | Rounding Bottom | Long TermExpleo Solution has formed rounding pattern on daily & weekly timeframe.
At the same time it has taken support at 0.382 Fibonacci retracement levels.
Which coincidentally is also the top of 2016 highs.
Hence support is extremely strong.
Invest for horizon>1yr.
Buy : 1650
Stoploss : 1550
Target : Short term : 1850, Medium term: 2200, Long Term: 2500

EXPLEOSOL - Weekly AnalysisIn the Weekly Chart of EXPLEOSOL ,
we can see that, it is near Trendline breakout.
Expected momentum is shown in graph.

The stock is trying to give a one year long range breakoutThe stock has today given a range breakout above 1450. Buy above 1485 level for further upmove in intraday.
If we get a day closing above 1485 then short term target would be 1530.
If we get a weekly closing above 1485 then positional target would be 1690.
This is a cash stock so kindly buy less qty here.
Learn & Earn,
Dr. Tanya Kumar


Anticipating Breakout in Expleosol | Price action reading I daily make educational content videos for swing/positional trading

Long ExpleosolpInvestment : Expleosol cmp 1330, can invest if get near 1280 odd levels sl 1220 wait for entry. Tgt 15% 1480-1500

1000% return will come till next decade (Investment Idea)Expleo Solutions Ltd is an India-based software service provider primarily delivering software validation and verification services to the BFSI industry worldwide.
Market Cap
₹ 1,394 Cr.
Current Price
₹ 1,355
High / Low
₹ 1,750 / 1,120
Stock P/E
16.9
Book Value
₹ 284
Dividend Yield
0.00 %
ROCE
30.6 %
ROE
23.6 %
Face Value
₹ 10.0
Debt
₹ 11.7 Cr.
EPS
₹ 80.3
PEG Ratio
0.95
Promoter holding
56.2 %
Intrinsic Value
₹ 910
Pledged percentage
0.00 %
EVEBITDA
10.3
Company is almost debt free.
Company is expected to give good quarter
Company has a good return on equity (ROE) track record: 3 Years ROE 26.2%
Expleo solutions ltd. it has given proper breakout symmetrical pattern. Now price has also move above 200 EMA. All of these indicating a price reversal from these levels, we can definitely expect this is going to touch previous highs soon and of course will go beyond and make new highs.
Technically and fundamentally all aspect strong for this ticker. This could be best investment pick for next decade. my Target will be 1000% price appreciation in this ticker. if anyone wants to just for trading then target is given on chart. Assume strong support zone area as your stop loss.
If you guy's really like my work then please like, follow and comment.
Thankyou.

BuyBuy at CMP 1412 stop loss 1330 daily closing basis target 4 times of Risk OR Life time High.
Disc : It's not an investment advise to buy or sell

Watch Out Watchout EXPLEOExpleo is up for Blast.
Follow the Trendline
You cant get a clearer Triangle Formation and its breakout.

Expleosol consolidatingExpleosol consolidating
Long term chart indicates cooldown after the rally.
Hovering near the resistance of 1288. For big upmove should cross 1380 decisively.
If not sustained , can break lower than the bottom line of bollinger.
No recommendations, Just my view based on chart pattern.

