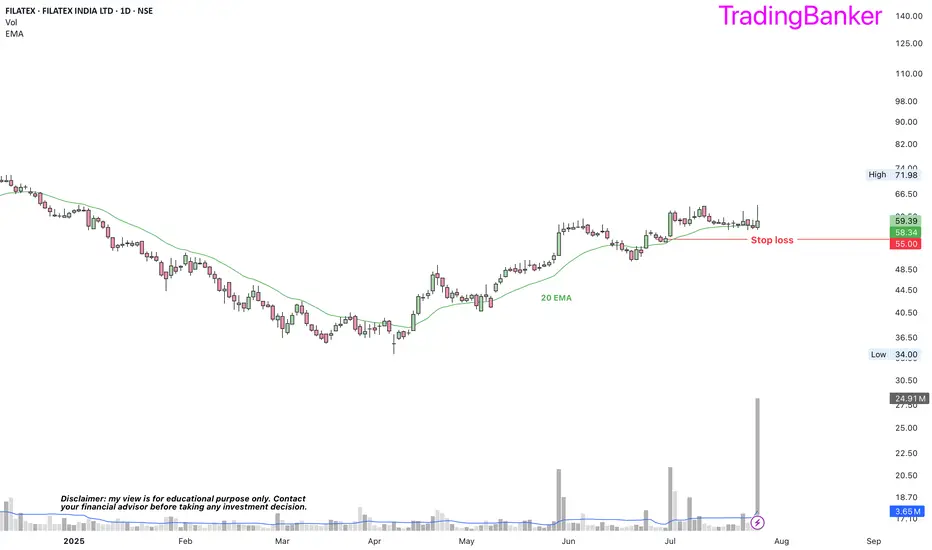
FILATEX: a probable long➡️decent RS rating
➡️improvement in EPS YoY, cash cycle and operating cash flow
➡️promoter holding at 65%
➡️trading above 20 EMA
➡️entered with a stop loss of 55
➡️huge volume spike
FILATEX trade ideas
Breakout from Descending Channel, Looking Very Strong
✅The stock has broken out of a descending channel on the daily chart, crossing the key resistance zone near 70 with strong volume. Sustaining above this level could lead to further upside towards the 76-80 range. RSI above 70 signals bullish momentum, making it an attractive setup for trend-following traders.


FILATEX🔶𝗜 𝘀𝗰𝗮𝗻𝗻𝗲𝗱 𝘁𝗵𝗿𝗼𝘂𝗴𝗵 𝗵𝘂𝗻𝗱𝗿𝗲𝗱𝘀 𝗼𝗳 𝘀𝘁𝗼𝗰𝗸𝘀 𝘀𝗼 𝘁𝗵𝗮𝘁 𝘆𝗼𝘂 𝗱𝗼𝗻'𝘁 𝗵𝗮𝘃𝗲 𝘁𝗼🔸
Here are My Top 8 Breakout Picks!
6. FILATEX
-improved margins year over year
-reduction in borrowings
-may benefit from Bangladesh unrest
-constant capacity expansion

Filatex- Currently at resistanceFilatex :
At Good resistance area, trying to breakout,
previous rejections
Need to sustain 68 levels


#Filatex India • suport level 58
• resistance level 62
• After break out level 70
• SL - 48.15
• Education purpose stock analysis

FILATEX waiting for good breakoutBullish view
above 64 close 1 day
Target : 76.80
SL : 57
Risk is yours and Reward is too yours totally

Investment Idea for Long term InvestorTrade idea for Long term Investors
High Reward Trade for High Risk Investors
Success rate 80% - 90%
"Realize Full Potential of a Stock by having Patience"
"Stock Market is more about What can happen rather-than what will Happen"
In Markets there is no 100% Guarantee but one can invest in High Probability Stocks
ALWAYS KEEP IN MIND
Rule 1 : Respect Target & Stop-loss.
Rule 2 : Hold the Trade until the Rule 1 is not met.
Rule 3 : SL on Day Close Basis
Rule 4 : Never do averaging if trade moves against your direction

Strong momentum, expecting a move towards 72 level soon- Symbol: FILATEX
- Pattern: Symmetrical Triangle Breakout
- Volume: High volume during breakout
- Retest: Retest of breakout level completed
- Support: Strong support from lower trendline
- Momentum: Strong momentum, expecting a move towards 72 level soon

Watchlist-Filatex-- stock in consolidation-wait for the breakout
--volume building
--Promoters increased stake is last Q from 1.57% to 24.81%
--Targets:- 58/65/70
Disclaimer:
- The view expressed here is my personal view
- Any decision you take, you need to take responsibility for the same
- It's your hard earned money. Treat it wisely
- Trade / Invest keeping in mind your trading style, goals and objectives, time horizon & risk tolerance
-- Do your own analysis and consult your financial adviser if needed

Filatex India: Inverse head & shoulder pattern breakout on WTFFilatex India is looking good on weekly time frame. Stock has given breakout of inverse head & shoulder pattern. Seems retest has also been done. Keep on radar.

3 Amazing swing trading ideas for 23 January MarketsI daily make educational content videos for swing / positional trading

Round Bottom Breakout - FILATEXPlease look into the chart for a detailed understanding.
Consider these for short-term & swing trades with 2% profit.
For BTST trades consider booking
target for 1%-2%
For long-term trades look out for resistance drawn above closing.
Please consider these ideas for educational purpose
Please note that, if there are some big targets, those are drawn thinking for long term.

Filatex India: Forming inverse head & shoulder patternFilatex india is looking good on weekly time frame. Stock is on the verge of inverse head & shoulder breakout pattern. Seems stock will also complete rounding bottom pattern. Keep on radar.


Positional BuyGo Long above 50
Sl 45, Tgt 55, 59, 69
30 days Trendline Breakout
RSI Cross above 50 level

Amazing weekly time frame swing trade idea for 17 Nov MarketsI daily make educational content video for swing / positional trading

Filatex breakout WeeklyTaking this trade due to following reasons as per marked entry and exit:
1. Candle patten – Bullish engulfing
2. Chart Pattern – Weekly breakout
3. Volume – increase in volume for past few weeks
4. RSI – Taking support at 50 and moving to 80’s
5. Moving average – Crossing 200 SMA


possible moves broken the pattern weekly tf
support and resistance
based on my view not a recommendation

Filatex - Bullish divergence RSI and PriceA bullish divergence happens when the Relative Strength Index (RSI) shows a low reading indicating oversold conditions, followed by a higher low in the RSI, while the price continues to make lower lows. This pattern may indicate that bullish momentum is building, and when the RSI breaks above the oversold level, it could be an opportunity to enter a new long position.
Above statement has been explained in the chart with invalid setup, when to enter and target to achieve.
Note: This chart is just for educational purpose.
