GLOBUS SPIRITS!!!!Globus Spirits is currently in an downward trend, but this stock has the potential to rebound fast.
This stock should be bought @750 as it shows an level for support.
If it still falls then stock should be AVG @660 as there is an strong support for the stock.
TARGET 1: 850
TARGET 2: 895
TRAGET 3: 960
.
please comment your views
.
NOTE: ELECTION PERIOD MATTERS!!!
Trade ideas

GLOBUSSPR - Ichimoku Breakout📈 Stock Name - Globus Spirits Limited
🌐 Ichimoku Cloud Setup:
1️⃣ Today's close is above the Conversion Line.
2️⃣ Future Kumo is Turning Bullish.
3️⃣ Chikou span is slanting upwards.
All these parameters are shouting BULLISH at the Current Market Price and even more bullishness anticipated AFTER crossing 950.
🚨Disclaimer: This is not a Buy or Sell recommendation. It's for educational purposes and a guiding light to learn trading in the market.
#CloudTrading
#IchimokuCloud
#IchimokuFollowers
#Ichimokuexpert
Excited about this analysis? Share your thoughts in the comments below!
👍 Like, Share, and Subscribe for daily market insights! 🚀
#StockAnalysis #MarketWatch #TradingEducation #ichimoku #midcap #smallcap #GLOBUSSPR

Globus Spirits moving up to touch the resistanceGlobus spirits has been in some down trend after it broke the support last September.
It is back at those levels and expecting it to touch the Green resistance line which earlier was the support for the chart.
Expecting levels of that resistance at 992 where it might resist and if it crosses the Blue line resistance and moves Up then the Green line Resistance will be faced at around 1088. Trend will change only after the green line resistance is crossed with huge volumes and decisively.
No recommendation, just my view based on chart pattern.

Globus Spirits Wave Counting and Next Targets 1700 and 2350!Here is why we are super bullish on Globus Spirits:
1. This stock has corrected deeply from the top (61.8% Fib).
2. Falling wedge pattern (proper buying angle).
3. Hidden bullish divergence.
4. Wave analysis: The stock has completed Waves A and B, and is now ready for Wave C.
5. Ichimoku turning positive.
We see great risk-to-reward in this stock. It has the potential to hit our targets and could rally even further.
Disclaimer: We are not SEBI registered. The content presented here is based on our personal opinions. Conduct your own research and consult with a qualified financial advisor before making any investment decisions.


GLOBUSSPRabove 820 closing basis may be good entry. considering 755 stop loss on closing basis
it may try to test supply around 970

Globus Spirits One More TimeStock has been waiting for reversals at strong supply zone 765. Previously it rallied from the same levels, Now it would be another opportunity for long term. For swing, can expect the target of @1070,
Stop loss would be below the support zone @760
disclaimer: Not a trading call.

Globus Spirits Ltd (GLOBUSSPR) Long Based on Elliott Wave analysis, it is possible to identify a potential wave count on the daily time frame.
The first and second waves have been successfully finished. Wave 3 is on the verge of commencing.
The level of invalidation is displayed.
Regarding the fundamentals of the stock:
ROCE: 18.5%
ROE: 14.7%
Promoter holding: 51.0 %
PEG Ratio: 0.27
I am not a registered Sebi analyst. My studies are purely for educational purposes.
Before trading or investing, please consult with your financial advisor. I am not accountable for your profits or losses in any way.
Thanks
VJ

Globus Spirits nearing supportGlobus Spirits has been in down trend for quite sometime, now it is nearing a multi point support around range from 650-660.
Personally, I feel it should show some positive move in the price up to the levels of 706-750-812
with base level of 652 and strong base at 553. Can move more of Volume is supported since its near long term support.
Need to also watch if it doesn't break that support to move further.
No recommendation, just my view based on chart pattern.

Globus Spirits in Triangle patternA good company with sound fundamentals available at good price. It has corrected almost 1000 point from recent high. If rejection faces at higher levels and enters in the range of 780-660, a small accumulation can take place provided by the history.
Can be bought at cmp with targets mentioned in the chart.
Stay invested.
Kindly note that I am not a SEBI registered analyst. Perform your own analysis before taking any trade.

Globus spirits a Good BuyGlobus Spirits a Good Buy
ROCE:- 18.5
ROCE 3 yr :- 27.8 (Highest in Industry)
ROCE 5 yr :- 21.8 (Highest in Industry)
Fixed Assests :- Increase of 19% after cwip completion
in q4f24 thus will lead to more sales
reason for fall :- contraction in OPM because of inflation input products
Targets :- 40% and 80% in one year

GLOBUS long green candle aheadtight consolidation below 100EMA.
expecting a long green candle.
took recent trendline support

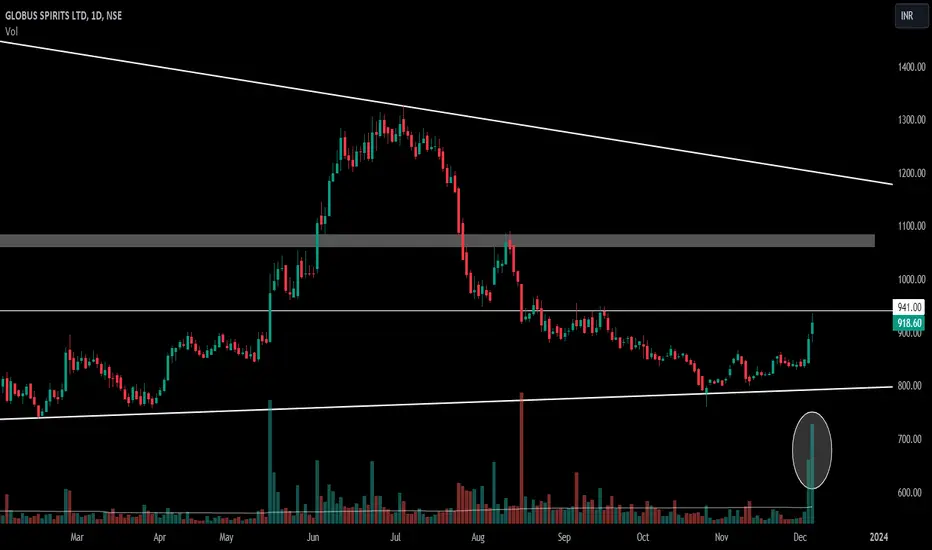
GLOBUSSPR - Long SetupNSE:GLOBUSSPR - Breaking out again near support Zone
✅ Gave a breakout at 973.50 as per pattern shown in chart
✅ Moved to 1300 levels
✅ Reversed midway much before Resistance 2
✅ Now again breaking out at 918.60
Chart is self-explanatory. Levels of breakout, possible up-moves (where stock may find resistances) and support (close below which, setup will be invalidated) are clearly defined.
Disclaimer: This is for demonstration and educational purpose only. This is not buying or selling recommendations. I am not SEBI registered. Please consult your financial advisor before taking any trade.

GLOBUS SPIRITSGLOBUS SPIRITS is near a resistance.
possible breakout (increased volumes in recent sessions)
keep on radar.
GLOBUS SPIRITSROUND 2
* Winter sales are coming soon expecting good numbers next quarter.
* will accumulate more near 52 week low of 720 zone
* revenue increasing at a consistent rate
*

GLOBUSSPRsimple ORB strategy....i will buy near EOD or trigger price line..after enter i will follow the (SL) and (TARGET)
not a call
its just my view educaltional purpose only

📈 Exciting Bullish Pattern In A Multibagger Stock Spotted! 🐂📊 Pattern: Rising Channel
📌 Symbol/Asset: Globus Spirits Ltd
🔍 Description: Potential Multibagger Stock on Strong Support of Channel & Law Of Polarity.
👉 Remember: Technical patterns are just one piece of the puzzle. Consider conducting further research, consulting with a financial advisor, and managing your risks appropriately.

Buy potential doubler traderBuy with stop below 4 for target of 1500.
This stock is fundamentally good and has completed correction and recently we are seeing that spirits stocks are pumping so this can be a good doubler.
Also buy kansai nerolac with stop loss below the wick this can give breakout of high of 354, risk reward is good and stock has grabbed liquidity.

Weekly Chart #W32The multiple stock analysed on weekly time frame.
1.Globus Spirits Ltd
2.Clean Science & Technology Ltd
3. ITI Ltd
4. Sagar Cements Ltd
5. Honda India Power Products Ltd
6. GMM Pfaudler Ltd
7. Jubilant Pharmova Ltd
8. Varroc Engineering Ltd
Thanks
-aJ
Disclaimer: The information and publications are not meant to be, and do not constitute, financial, investment, trading or any other types of advice or recommendations.

GLOBUSSPR's Chart: Bullish Breakout and Harmonic PatternIn this analysis, we will delve into GLOBUSSPR's chart to evaluate its recent breakout of the falling trendline, the subsequent retest, and the potential bounce from the 200-day exponential moving average (EMA). Additionally, we will explore the presence of a 5-O Harmonic Pattern on the chart. Based on the technical analysis, we will provide insights into a potential trading opportunity. Let's proceed with the analysis.
Chart Analysis:
Upon reviewing the provided TradingView chart for GLOBUSSPR, we can identify several key technical factors that may influence the stock's price action.
Breakout and Retest of Falling Trendline:
The chart indicates that GLOBUSSPR experienced a breakout of the falling trendline approximately 10 weeks ago, followed by a successful retest of the breakout level. The retest confirms the previous resistance has now turned into support, signaling potential strength in the current uptrend.
Approaching Support at RSI:
The Relative Strength Index (RSI) is approaching support, indicating that the stock's momentum is stabilizing. RSI is a momentum oscillator that measures the speed and change of price movements. A potential bounce from the RSI support may add to the bullish case for the stock.
Potential Bounce from 200-day EMA:
GLOBUSSPR is currently trading near the 200-day exponential moving average (EMA), which is a widely followed indicator for determining long-term trends. The stock may find support and potentially take a bounce from this moving average, further supporting the bullish outlook.
5-O Harmonic Pattern:
The chart shows the formation of a 5-O Harmonic Pattern. Harmonic patterns are geometric price patterns that indicate potential trend reversals or continuation. The presence of this pattern adds to the bullish technical signals on the chart.
Trading Opportunity and Targets:
Based on the technical analysis, a potential trading opportunity arises with GLOBUSSPR's breakout, successful retest, approaching RSI support, and the presence of the Harmonic Pattern. Traders may consider initiating a long position above ₹978, with a stop loss set at ₹923 to manage potential risks.
For the targets, the first target is ₹1033, which may act as an immediate resistance level based on the chart's price action. The second target is ₹1088, indicating potential further upside.
Conclusion:
The technical analysis of GLOBUSSPR's chart suggests a bullish outlook with the breakout of the falling trendline, successful retest, approaching RSI support, and the presence of the Harmonic Pattern. Traders may consider entering a long position above ₹978, with stop loss and targets as mentioned above.
Please remember that the stock market carries inherent risks, and past performance is not indicative of future results. It is advisable to conduct thorough research and consider consulting with a financial advisor before making any investment decisions. Additionally, traders should closely monitor the stock's price action and consider implementing appropriate risk management strategies.

Globus Spirits - 10 month Range Breakout with Huge VolumeFrom past 10 months, the stock was consolidating and range bound between Rs 730 to 900.
Today's price movement broken the resistance with huge volume and positively closed above 200 ema.
Safe entry at Rs 930, Stop Loss below Rs 844, Targets market in chart.
Thanks
-AJ
Disclaimer: The information and publications are not meant to be, and do not constitute, financial, investment, trading or any other types of advice or recommendations.

BUY GLOBUS SPRITSgood rounding bottom happening on daily and weekly charts. Buy above 990 on weekly closing basis for 1300 to 1600 in medium term. After breakout keep stop below 870-880 range on weekly close. Fundamental are good in this small cap spirits and ethanol play

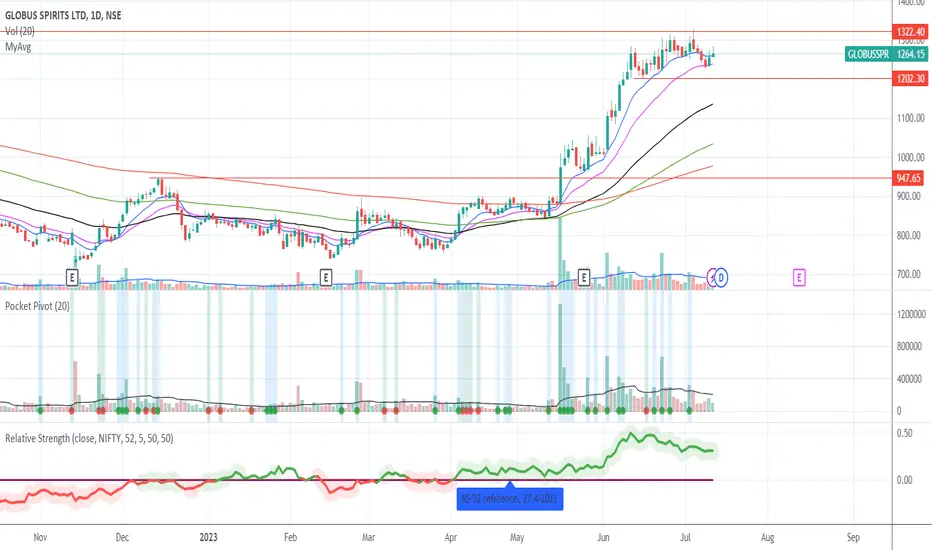
GLOBUS Holding levelsit is holding 20EMA levels. and consolidating between 1200-1300. may be once long term averages catch up next leg of rally may start. results are due for Aug 12. keep it in watchlist.