GodrejCP breakoutGodrej CP breakout of TL in D time frame. Swing traders can plan with proper risk management.
GODREJCP trade ideas

Godrej Consumer Probably we have finished correction ?After making high it seems we are done with the FLAT correction (C) after a last leg 5 Red is finished as long as it doesn't extend much beyond 858.85 level.
AS the connect (B) Blue seems very shallow hence their is possibility of it making a bounce and forming new connector (c) blue which means we can even have one more leg Downside to complete the correction.
We will watch this stock how it performs.


Swing Opportunity in Godrej Consumer Products Go Long above 947.1 for Targets of 1010.55, 1074, with SL 883.65
Reasons to go Long :
1. On a daily timeframe if we draw the Fibonacci retracement tool from recent swing low (point A) to recent swing high (point B) then we see stock took support from 0.5 Fibonacci level.
2. A bullish chart pattern, Double Bottom (W pattern) is formed around 0.5 Fibonacci level.
3. Also there is a strong demand zone (marked with purple color), from which the stock initially faced resistance but now is taking support and moving up.
4. Also the stock gave a trendline breakout.


Godrejcp forms a CUP & HANDLE in weekly chart.To confirm the validity of the chart, we have to wait till 1138.
If it cross above 1138 and possible to retest back to 1138 level
Then we can go for LONG if it starts to move up from 1138.
A fundamentally STRONG one.
Expected level for LONG term 1630.

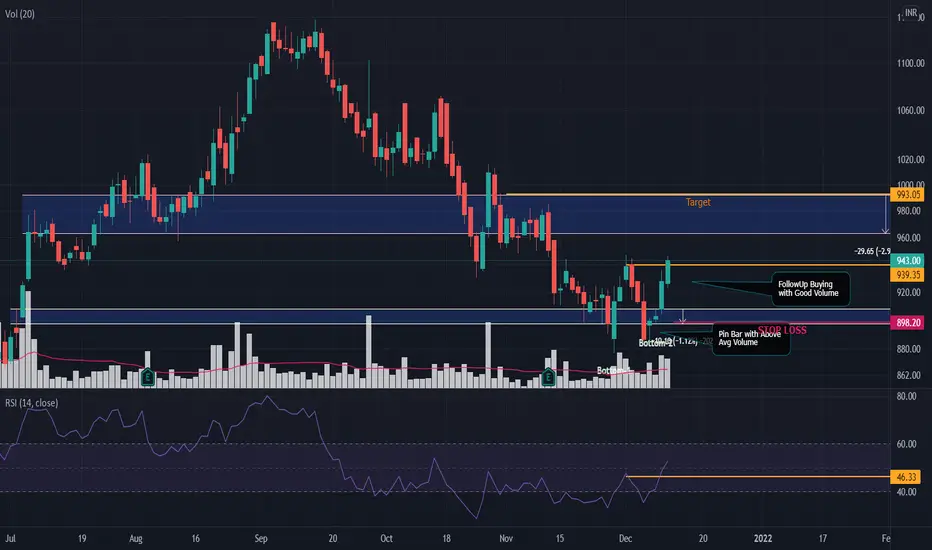
GODREJCP - Double Bottom SetupDouble Bottom Setup , Pin Bar and Followup buying seen. Good time to Enter

Godrej CPGodrej CP
risky buy at cmp with current low as a SL
safe can wait for to break previous swing high/Trendline


Downtrend in Godrej PropertiesThe scrip has been in down tred for few weeks and is making lower lows and lower high and again it has taken resistance from trend line.
The scrap can be shorted at CMP for TGTof around 877 for swing trade

Godrej Consumer - Market Leader in several products Inverted Head and Shoulder Buy @683 give with target of 1180

Godrej Consumer Cmp 939 dated 1.12.2021Godrej Consumer Cmp 939 dated 1.12.2021
1. Falling Wedge BO above 945.
2. RSI already had Triangle BO.
Buy for a tgt of 955-985-1015-1035-1060 SL 895
It is just a view, pls trade at your own risk.

GODREJCP | Falling wedge breakout - Looks potential for 20%GODREJCP | Falling wedge breakout - Looks potential for 20%
CMP : 940
SL : 875
Target : 1000, 1130
1:3+ risk reward setup (2nd target)

Godrej consurmer to take long entryLong Godrej consumer above 925 .Entry after the BO of the reistantance area. Target 960 SL 915. on a daily basis we have seen a bullish engulfing candle on the chart & RSI also touched the level of 60. Good risk to reward ratio. This is for your educational purpose only.


Watch out for Godrej CP. Crucial level.GODREJCP Daily Chart Analysis:
This counter is trading currently at 20% down from its ATH. After the break down form the trendline, the price has fallen to its 200 EMA on Daily chart.
GodrejCP can prove to be a good swing trade with upside potential of 20-23%, if it takes support on this level and shows signs of reversal.
In case it closes strongly below 900, we might see the fall till the levels of 800.


Is trend reversing in Godrej Consumer?Is trend reversing in Godrej Consumer?
Reasons/Traits :
• Price is exactly at a point for breakdown of the trend (4th time trying to breakdown)
• 0.236 level will it break or take support to go up?
• Price about to touch 50 EMA
• Bullish since May
• RSI strength is reducing and is below 50
• Price is lower than previous higher highs
• Perfectly trying to reverse the wave trend
What can happen next :
Scenario 1 : Price sustaining 0.236 level can go up to 1140 and up taking 50 EMA support
Scenario 2 : Price break down of trend or 0.236 levels go to 0.382/0.5/0.618 levels to meet 200 EMA
Disclaimer : This analysis is only for educational purpose and not be considered as any trading idea/tip. Please consult your financial advisor before you take any trade and we are no way responsible for your profits/losses. Thank you!

Only for learning purposeWaiting for Conformation . Not a trade recommendation only for learning purpose
