GraphiteAnalysis of the Chart for Graphite India Ltd (NSE)
Key Observations:
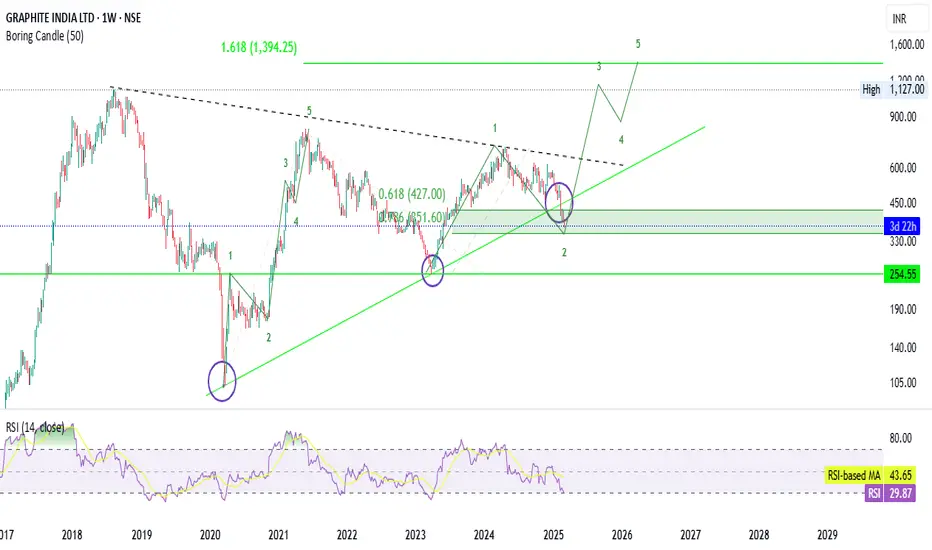
Elliott Wave Count:
The chart follows an Elliott Wave pattern.
It shows a Wave 1 and Wave 2 completion and a potential Wave 3 initiation.
The projection suggests a strong upward movement for Wave 3, followed by corrective Wave 4 and final Wave 5.
Support and Resistance Levels:
Support Zones: Around ₹254.55 and ₹330.00.
Resistance Levels: Fibonacci projections indicate key resistance near ₹427.00, ₹1,127.00, and ₹1,394.25.
Trendline & Fibonacci Levels:
The price has tested the trendline multiple times, acting as strong support.
Fibonacci retracement levels at 0.618 (₹427.00) and 0.786 (₹151.60) indicate key reaction points.
RSI (Relative Strength Index):
Current RSI = 29.87, which is in the oversold zone (<30). This suggests that the stock might be undervalued and could be due for a bounce-back.
Suggestions:
Bullish Outlook:
If price holds above ₹330 and confirms a reversal, it may trigger Wave 3 rally.
First upside target is around ₹427, followed by ₹1,127 (historical resistance) and potential ₹1,394 (Fibonacci 1.618 level).
Entry could be considered near ₹330 with a stop-loss around ₹254 for risk management.
Bearish Scenario:
If ₹330 support fails, then ₹254 becomes the last major support.
Below ₹254, a bearish breakdown can occur.
Conclusion:
Short-term traders can look for a bounce from ₹330 with a stop-loss at ₹254.
Long-term investors can consider adding positions on dips, aiming for ₹1,127–₹1,394 over the next few years.
Confirmation via volume and breakout above ₹427 is recommended before taking aggressive long positions.
GRAPHITE trade ideas
this is just a analysis no recommendation of buy or sellthats a good pennant formation ,can make a fake breakout for seller or buyer and then make a bigger moves in one side which will be strongest

19th jan, journey so far in option with small capitalhello everyone,
i started trade with small capital in my second account just to see how much i can make in year
its beem more than 20 days and there were several mistakes i did
i am posting this to let you know to avoid those mistakes which i idi
although profitable certain drawdowns were huge,

GRAPHITE INDIA : Expecting A Strong Break!⚡Price Analysis:
1️⃣ Price bounced from the demand zone
2️⃣ Price structure is bullish.
3️⃣ EMAs show casting good momentum & strength.
4️⃣ Volumes are decent.
✨ My Expectations:
➡️ RRR is very good.
➡️ 1:3RRR can be expected w/ 5% SL.
➡️ Need strong candle closing mostly around 600 then this stock will be unstoppable.🧿
⚠️ Disclaimer: This is NOT a buy/sell recommendation. This post is meant for learning purposes only. Views are personal. Please, do your due diligence before investing.⚠️
💬 Drop your thoughts below in the comments section if you liked this analysis!✌️
🔥Happy trading!✅🚀

GRAPHITE Here is the analysis of the chart I have done.
Please view this chart as a reference and consult your financial advisor before making any investment decisions.

Trendline breakout in GraphiteThere is a trendline breakout in Graphite today. From here, we can expect targets of 525, 531, 551.

Graphite India cmp 521.60 by Monthly Chart view*Graphite India cmp 521.60 by Monthly Chart view*
- Support Zone 455 to 490 Price Band
- Stock Price is well above the EMA 21, 50, 100, 200
- Stock Price has tested retested Support Zone well enough for Fresh Breakout
- Weekly Support at 445 > 380 > 310 with Resistance at 595 > 670 > 740 > ATH 815.90
- *Monthly Stock Chart indicative of good probability for a Fresh Upside Breakout basis Multiple Test Retest of the Support Zone*

Graphite India for 100%+ upsideDate: 21 Sep’24
Timeframe: Weekly chart
Graphite India currently seems to be in Wave III of 3 which is heading towards 1400 levels (130% growth from current price) as seen in the chart. Even if it attains its previous all time high of August 2018, that’s almost double its current price. If one can handle the fluctuations that operators inject from time to time and hold tight, this one is a no brainer.
This is not a trade recommendation. Please do your own analysis.

Graphite ... ready for uptrendcurrent RSI > 60 which shows it has strength
Target 1 : 640
Target 2 : 700
CMP : 601
SL : 580
This is the correct time to enter the trade

GRAPHITEGRAPHITE seems good above 625... 625 is a hurdle... Once it crosses above this may attracted towards 800 levels

GRAPHITE LTD LONGTaking a support from Aug 2023- Graphite has taken a support this month and has created a bullish engulfing candle on this weeks closing.
~Bullish engulfing candles are highly bullish in nature & RSI Reversal.
One can see above 530
T1 606 T2 707
SL 495

Graphite India Ltd - Breakout OpportunityDate : 24-Sep-2024
LTP : Rs. 598.15
Resistance Levels: (R1) Rs. 709 --> (R2) Rs. 815
Support Levels : (S1) Rs. 495
Technical View:
• NSE:GRAPHITE is in strong primary uptrend and was recently going through it's secondary downtrend within primary uptrend.
• After touching the high of 709.40 on 25-Apr-2024, it has retraced 32% to 485.15 level.
• NSE:GRAPHITE has breakout from it's secondary downtrend with higher than average volume. Breakout is also supported by increased volume in last few sessions.
• NSE:GRAPHITE is trading above both 20 DMA and 50 DMA since last few sessions. 20 DMA has crossed over 50 DMA on 23-Sep-2024.
• RSI is trading at 70.65. MACD is trading at 15.70. Both MACD and RSI is showing positive momentum.
• Looking good for a new swing from here.
Like the analysis? Boost/Like this idea and follow my ID.
Disclaimer : I am not a SEBI registered analyst/consultant and not recommending anyone to take any BUY or SELL position in stock market. Investing in stock market is risky and one should do a self analysis and validation before investing in stock market. My ideas are published for learning purpose only and are available to everyone at no cost/charge.

Graphite India looks like a promising UP SIDEGraphite India looks like a promising opportunity for accumulation at current levels, with potential for a 20% upside by the next quarter. Given its recent performance and market conditions, it could be a solid addition to the portfolio for mid-term gains. What's your take on it? Do share your feedback!

Graphite India Limited: Ready for a Bullish Breakout?Following a prolonged downtrend spanning five months, Graphite India Limited appears poised for a potential bullish reversal.
A pivotal indication of a changing market structure is anticipated as Graphite India approaches the end of a BOS. A confirmed shift in CHoCH would be a strong signal for investors, indicating a potential transition from bearish to bullish momentum.
On the daily timeframe, a notable double bottom pattern has been identified. This pattern typically indicates a reversal from a downtrend to an uptrend, strengthening the case for a bullish outlook.
The present price action demonstrates a close above the equilibrium level, which can serve as a psychological and technical support point. This level is often critical in affirming bullish sentiment among traders.
The weekly MACD has exhibited a bullish crossover, with the MACD line crossing above the signal line. Furthermore, the histogram transitioning into positive territory indicates increasing momentum that may support a shift in the prevailing trend.
The RSI metric is currently reflecting strength as it moves away from oversold conditions. An RSI reading above 50 typically indicates bullish momentum and may signify growing buying interest among market participants.
A successful close above the price level of ₹624 could catalyze upward momentum towards the next resistance level at ₹696 . This point will be critical in determining whether the bullish trend can sustain itself. A support floor is identified at ₹485 , which would serve as a critical level of protection for investors should the price experience short-term volatility.
Based on the outlined technical analysis there may be an opportunity for an approximate 18% return on investment from the current price levels in the short term, contingent upon successful price action and trend confirmation.
Disclaimer: This technical analysis report is intended for informational and educational purposes only and should not be interpreted as financial advice. Investors should consult a qualified financial advisor or conduct thorough personal research prior to making any investment decisions. All trading involves risk, and past performance is not indicative of future results.

Graphite Stock AnalysisSymmetrical Triangle Pattern Breakout and Retest Done.
Cup and handle pattern possible
50 MA Support
Decent Volumes

GRAPHITE STOCK :- GRAPHITE
TREND :- POSITIVE
SETUP :- DOUBLE BOTTOM BREAKOUT WITH BIG VOLUMES
TIMEFRAME :- DAILY
BUY :- AT CURRENT PRICE WITH SPLIT FORM CAPITAL
STOPLOSS :- BREAKOUT CANDLE LOW
TARGET :- 1:2 RISK REWARD
NOTE :- please consult your advisor before investing in stocks which i recommended

GRAPHITEGRAPHITE SUPPORT taken 500 , formed trend line pattern and has created a bullish engulfing candle on this weeks closing bias. RSI is near to 40, target and sl is given, volume increased by fii in this stocks september month

Graphite INDIA- EV Boom - Buy Above 592Graphite India - leading manufacturers of graphite electrodes, which are essential for electric arc furnace (EAF) steelmaking.
Graphite India Limited is one of India's leading manufacturers of graphite electrodes, which are essential for electric arc furnace (EAF) steelmaking. Founded in 1974, the company also produces graphite-related products for industrial applications, such as high-temperature and corrosion-resistant materials. Its headquarters are in Kolkata, India, with manufacturing facilities spread across the country.
Financials:
Graphite India has experienced fluctuations in its financial performance due to the cyclical nature of the steel industry. In recent years, the company's revenue and profitability were affected by the downturn in global steel demand and rising input costs. However, the company has remained financially stable due to its low debt levels and significant cash reserves. Graphite electrodes are a key driver of the company’s revenue, and price changes in the global market impact its profitability.
Growth in the EV Sector:
With the rise of electric vehicles (EVs), demand for batteries and associated components has grown. Graphite India stands to benefit indirectly from this growth. Graphite is a crucial material in lithium-ion batteries, which power most EVs. While the company’s primary focus is on electrodes for steel production, it is exploring opportunities in the EV supply chain. This diversification could open new revenue streams and reduce dependence on steel industry cycles.
Future Revenue & Sales Opportunities:
The future growth of Graphite India is tied to global trends in steel production, EV battery materials, and graphite-based products. With increasing investments in renewable energy and EV adoption, the company has the potential to tap into the graphite market for energy storage solutions. Expanding its presence in battery-grade graphite could provide long-term growth opportunities. Additionally, technological advancements and a focus on sustainability may allow Graphite India to strengthen its market position.
Chart Details :
The stock has gvien double bottom breakout. and one can enter above - 592. for targets of 700/800 and above that open sky.
Stop Loss - 500.
Above 700. Stock will form Cup and Handle.
Disclaimer : Educational Content. Please do your own research.

Turning Bullish: Graphite India LtdGraphite has recovered nicely from the important support level of 500.
It is just trading below the next resistance of 545.
Key resistances on the upside are 575, 625, and 673 levels.
Key Points to observe:
Net profit has considerably increased from Rs. 16 Cr. in Mar 2024 to Rs. 236 Cr. in Jun 2024
Net cash flow has also increased to Rs. 14 Cr in Mar 2024 When compared to Rs. -45 Cr. in Mar 2023
However, the return on equity has been low 5.24% over the last 3 years.
It can be a good long-term candidate.

Graphite india shortGraphite india short for the target of 330. Sl below the trend line.
Chart is self explanatory. Please follow the price action & take the trade as per your appetite.
The information provided here is only for educational purpose. The information provided here is not intended to be any kind of financial advice, investment advice, and trading advice. Investment in stock market is very risky and trading stocks, options and other securities involve risk. The risk of loss in stock market can be substantial. Moreover, I am not a SEBI registered analyst, so before taking any decision or before investing in any Share consult your financial advisor and also do your analysis and research.
Request your support and engagement by liking and commenting & follow to provide encouragement.

Stock in Buying Zone: Graphite Ind.The stock is in a downtrend.
Currently holding the 550 levels strongly.
The next strong resistance is around 605.
Can enter for a long-term target of 710.

Graphite india Inverse head n shoulder patternStock is trading at 555.
It is making a inverse head n shoulder pattern on a weekly time frame.
Breakout Confirmation is still pending.
Midterm target will be 644/740/825
This is for educational purpose. Not a buy/sell recommendation.

Graphite IndiaHello and welcome to this analysis
A likely triangle taking place currently in higher time frame suggesting breakout above 775 or support (likely last leg of triangle) at 550-450.
Overall short term could be sideways, medium to long term appears bullish.
Happy Investing
