Grasim Cmp 1636 dated 21.12.2021Grasim Cmp 1636 dated 21.12.2021
1. Taken Support at the trendline.
2. RSI Divergence.
Buy for a tgt of 1670-1715-1750 SL 1600
It is just a view, pls trade at your own risk.
GRASIM trade ideas


GRASIM is on a support lineNSE:GRASIM is on a two support line one is a trendline and another is a resistance turning into a support and showing a weak signal in two stanza :-
1. As per the market sentiments are weak due to which the support might not sustain
2. And another is that the trendline has already tested multiple support so this time might not be strong enough to make move grasim upward again
Thus, my idea is bearish in GRASIM
SL-1655 || Target-1528
DO like it its worth!!!

Simple Trade Setup | GRASIM | 14-12-2021 [ INTRADAY ]NSE:GRASIM
Observations:
1) On 1day time frame,it managed to sustain above 50DMA.
If it take support from 50DMA and trades above it then we can see an up move.
50DMA is placed at 1729.64 level.
Please refer below chart : 1day Time Frame.
2) Also On 1day time frame, it made double bottom pattern and sustain above the mid neckline of it.
Major breakout level range is 1360-1370 level range.
Please refer below chart : 1day Time Frame.
-------------------------------------
Trade Setup for Date: 14-12-2021
1) Don't Jump in to trade at the beginning of the market. Let it get settle for 15-20min first and judge the price action.
2) Everything is mentioned on the chart. I hope it is easy to understand.
3) All the levels will work as support, resistance, entry and exit w.r.t price action near that level.
4) Avoid gap up or gap down chase. Wait and trade between levels.
Please refer below chart for levels.
Hope I made it easy to understand it.
Do comment your doubt or suggestion.
Note: Trade with Strict SL. It may or may not hit all the levels. So one can book profit / loss at respective level considering how price action works near that level.

Grasim Long oppurtunitydouble bottom breakout AND consildation above resistance level in a trianlge pattern.
breakout can generate good momentum on the upside. keep this stock in radar

Grasim HourlyA volatility contraction pattern being formed here, pricelikely to breakout from here and target levels are mentioned, along with 2 different SL


Grasim short term for sellTrade based:
Day tf retracement going on.
In hr tf still it was a down trend, market respect the hr tf fib retracement.
based on that, when market break the 15 min support then we can expect short term fall in grasim.

Short GrasimEntry : below 1700( 5 min close below 17450)
Stop Loss ; 1742 ( 5 MIN Cross above 17660)
Target 1 : 1650
Target 2 : 1589

GRASIM important levels for long term investmentGRASIM important levels for long term investment
Level 4 = 1223
Level 3 = 934
Level 2 = 704
Level 1 = 472


Example of Support, Resistance and RetestThe chart is self-explanatory. The main benefit of entering into a trade at the time of retesting the resistance area is that our stop loss becomes small at that point. And risk-reward ratio appears good there.
Hope the interpretations will help some of you in your trading approach. As me-too learning from others.
Wish you success.

GRASIM long long opportunity in Grasim .
after breakout in weekly timeframe it conslidated for months , now it is at the retest levels and can go up from this point .
not any recommendation
just for educational purpose

#Grasim cash : Looks good sell around 1750-60#Grasim cash -Positional call
24 - Nov 2021
Looks good sell around 1760
stoploss 1800
Target 1720/1680/1650
Cmp 1737

Grasim💥GRASIM💥
*Complete risky trade*
Only if it sustain above 1800-1805 levels. 🙌
Took support from major trendline support.
Flag pattern as its following previously on the major trendline.
Trade as per the behaviour of the stock. 🙌

GRASIM SHORT TERM BUTTrade based:
Hr tf swing formation and swing correction
in lower tf 15 Min, forms like a double bottom, when it break then we can expect a trend continuation.


buy grasimbuy grasim for intraday
buy zone1880
target and sl mentioned in chart.
manage risk properly.
reason for buy = check 1h chart in strong uptrend. if rsi cross 60 upside and break a corrective pattern execute the trade.
thank u friends.
plz like and comment
. i m always ready for ur help in trading.

GRASIM CASe studyMultiple harmonic pattern formation with PRZ in same range,,
parallel channel structure with supply line around same levels of prz,,
rsi have divergence,,
price action need to be watched,,
lets see whats in store,,
Market is best teacher,, keep learning every day,, dont wait for holy grail

Grasim Momentum Long Prices having Good Momentum
All Levels Mentioned On Chart
How to trade the setup?
When the chart says Long or Short at particular level, Put a Stop Order at those levels, Levels are strict
T1 : is Target 1
T2 : is Target 2
When you achieve your first target, book profits of 50%
and shift the stops to the cost
The term Catastrophe Stop, is a maximum movement of price that can happen in opposite direction of trade
so that the setup remains valid, Its basically used, to give some breathing space to the trade,
I may call for a recovery if the setup becomes invalid as the market progress.
As we all know anything can happen in the market and we should respect that
The Idea is for Educational purpose only
At Last, do your own analysis, before trading your money!

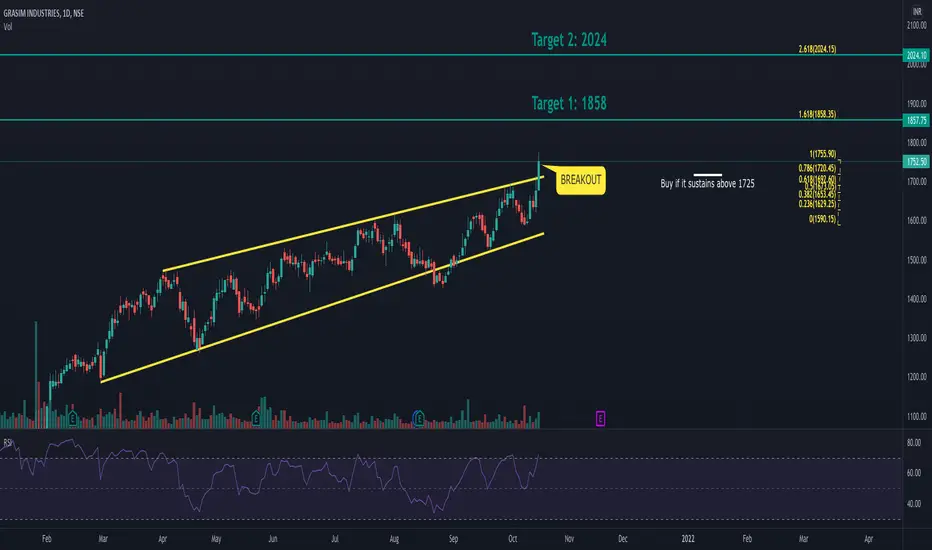
GRASIM - Parallel Channel BreakoutThe stock was moving in a channel for a few months now, and gave a breakout over the upper resistance line.
If it is able to sustain levels of 1725, the trade can be initiated for upwards targets as stated in the chart.
Please follow us for more trading setups like these.
If you have any queries/suggestions related to above pattern, feel free to type below in the comment section.
Do show your love by pressing the like if you liked the idea.