Gujarat State Fertilizers& Chemicals(37% approx upside potential
Sector: Fertilizers
script makes HH & HL pattern in HTF ... now it is in HTF demand zone
daily turns bullish n seems start making HH& HL pattern n continue its bullish trend...
so one can buy for the target 275/285/315
Trade ideas

GSFC - Long Setup, Move is ON..NSE:GSFC
✅ #GSFC trading above Resistance of 309
✅ Next Resistance is at 382
Related charts:
Charts are self-explanatory. Levels of breakout, possible up-moves (where stock may find resistances) and support (close below which, setup will be invalidated) are clearly defined.
Disclaimer: This is for demonstration and educational purpose only. This is not buying or selling recommendations. I am not SEBI registered. Please consult your financial advisor before taking any trade.

#Gsfc cash : Looks good around 300-305#GSFC Cash - Positional call
22.01.2024
Looks good around 300-305
Stoploss 270
Tgt 400/500
Cmp 318.10

GSFC BEST SWING SETUPBEST SWING SRTUP & BUGET STOCK MONOPOLY STOCK
Decisions to buy, sell, hold or trade in securities, commodities and other investments involve risk and are best made based on the advice of qualified financial professionals. Any trading in securities or other investments involves a risk of substantial losses. The practice of "Day Trading" involves particularly high risks and can cause you to lose substantial sums of money. Before undertaking any trading program, you should consult a qualified financial professional. Please consider carefully whether such trading is suitable for you in light of your financial condition and ability to bear financial risks. Under no circumstances shall we be liable for any loss or damage you or anyone else incurs as a result of any trading or investment activity that you or anyone else engages in based on any information or material you receive through TradingView or our services.

GSFC Currently ON only 8.25 PE Ratio..It is engaged in manufacturing of various fertilizers and industrial products like plastics & synthetic rubbers and man-made fibres.
Target- 300
focus On fertiliser Stocks
next breakout sector is fertiliser.
-Coromandel Inter
-Chambal Fert.
-Fertilizers & Chemicals Travancore Ltd
-GNFC

GSFC Analysis(Descending Triangle)!GSFC Analysis on Weekly Timeframe
Descending Triangle Pattern Formation in GSFC on Weekly Timeframe!
Descending Triangle Pattern Breakout on Upper Side!
Bullish view on GSFC!
GSFC has made Descending Triangle Pattern on Weekly Timeframe. GSFC has given a huge breakout on the upper resistance trendline. We should wait for retest because we don't want to buy it at higher price so we are waiting for a decent retesting. We can see a huge breakout volume so we need to wait for the volume adjustment for avoiding the breakout trap.
Trade Psychology and setup =
Entry = After Retesting between 147.10 - 153.30
Target = Target will be 241.40
Stop Loss = Below 122.35
Disclaimer = All my analysis are for Educational Purpose only. Before entering into any trade - 1) Educate Yourself 2) Do your own research and analysis 3) Define your Risk to Reward ratio 4)Don't trade with full capital

Gujarat State Fertilizers & Chemical Ltd- Long Setup, Move is ON#GSFC trading above Resistance of 250
Next Resistance is at 387
Support is at 166
Here is previous chart:
Chart is self explanatory. Levels of breakout, possible up-moves (where stock may find resistances) and support (close below which, setup will be invalidated) are clearly defined.
Disclaimer: This is for demonstration and educational purpose only. This is not buying or selling recommendations. I am not SEBI registered. Please consult your financial advisor before taking any trade.

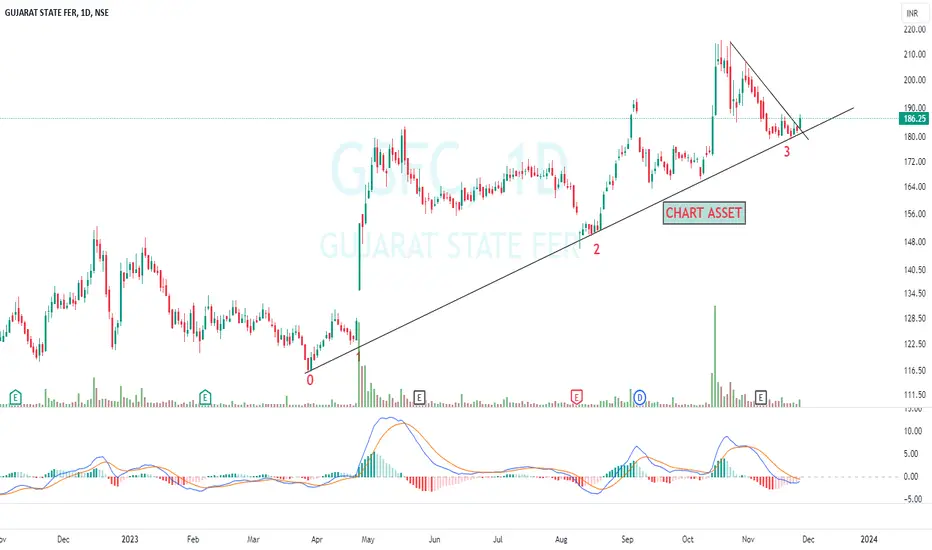
GSFC May start bull move as per trendline conceptGSFC Touched trendline 3rd time and it is make or Break time but PSU sector only making histories in these decade so go long only
Breakout After 11 Years Looking very Strong-11 years old trendline breakout
-Institutions are active in this stock from previous few sessions
-every single indicator showing strenght

Swing Trade - LongIts a good time to buy for the swing trade.
Breakout and waiting for the good up move.

GSFC - Long Setup, Move is ON..NSE:GSFC
✅ #GSFC trading above Resistance of 234
✅ Next Resistance is at 309
Related charts:
Charts are self-explanatory. Levels of breakout, possible up-moves (where stock may find resistances) and support (close below which, setup will be invalidated) are clearly defined.
Disclaimer: This is for demonstration and educational purpose only. This is not buying or selling recommendations. I am not SEBI registered. Please consult your financial advisor before taking any trade.

GSFC for 35% (approx..) GainAnother PSU Gujarat State Fertilizers & Chemicals ltd a government company has given long 1.5 year Consolidation Breakout with good amount of volume. fundamental is also good you can check on below link... ( www.screener.in )
CMP : 186
TG : 240
SL : Below 21 daily EMA
Stock's selection based on 5 Point Analysis:
1: Idea : Breakout.
2: Support : Volume, Delivery & VWAP. ( To view this, click sedg.in )
3: Technical : 9/21/55/200-EMA, RS>0, MACD, RSI & Super trend up. ( To view this, click sedg.in )
4: Fundamental : PE, PAT, Industry & peer PE and sector performance. ( www.screener.in )
5: Timing : Entry Timing on Daily chart.
Disclaimer : It is my personal view as a trader and for educational purpose only. Equity market involves risk .
Please consult your financial adviser before taking any decision.

GSFC swing ideaGujarat State Fertilizers & Chemicals Ltd is currently trading at 174.
The price is currently trading above its 20 & 50 EMA'S supported with rising volumes.
If stocks holds to 165-170 levels a possible upside movement is expected.
Targets t1 of previous high that is 199 and t2 of all time high 230 is expected.
Immediate support levels are 165 and 140 respectively.
Please do your own analysis before taking any position.

Resistance Breakout - GSFCPlease look into the chart for a detailed understanding.
Consider these for short-term & swing trades with 2% profit.
For BTST trades consider booking
target for 1%-2%
For long-term trades look out for resistance drawn above closing.
Please consider these ideas for educational purpose
Please note that, if there are some big targets, those are drawn thinking for long term.

A clear Five year TL Breakout in GSFC.GSFC has shown a clear TL Breakout in a Five Year TF. Ideal to enter.

GSFC - Ascending Triangle Pattern 🚀🚀 Don't miss this swing trading opportunity in GSFC! The ascending triangle pattern is breaking out with a volume spike, indicating potential upward movement. Explore this buy-trade setup now.
#SwingTrading #StockAnalysis

Gujarat State Fertilizers & Chemicals Limitedstock history is rounding bottom breakout and forming rounding bottom and continue.
as per history data rounding bottom breakout completed. now the stock could form the consolidation phase( parallel channel).
wait for the channel breakout for bull entry.
this week i expect the short trend target - s2 till support.
this week weekly cpr narrow range.

Buy ideaGSFC looks like a 6 year cup and handle pattern breakout and almost its all time high. Weekly RSI is above 60 which clearly indicates that the stock is showing good momentum to play and if you apply Bollinger band, you come to know that volatility is also there. One can go with this stock for a short term tgt of 199, mid term tgt of 230 and long term tgt of 299. We are looking Weekly chart so views share for atleast 6 months to 1 year for long term target.

#GFSC VCP BO with VolumeDTF formed VCP, BO with Volume after volume dry
up,
RS Line no 52WH
EMA rule in place.
4 star set up


Cup and Handle BreakoutCompany with 0 Debt , 1200cr Cash balance, has good MTM 1000cr+ profit in investments made, and even at lowest Operating profit levels the company can generate around 600cr Free cash flow
Target - 230 to 240
+ve triggers - China Urea Ban, Buyback/Dividend (Since cash bal is >1000cr)

Break of multiple trendline1.Formation of cup pattern
2.Break of trendlines with volume
3.Chances of gap up is high
strong resistance is 195.3

GSFC - Weekly AnalysisIn the Weekly Chart of GSFC ,
we can see that, after the Failure of Cup & Handle, It has shown recovery with Pole & Flag breakout.
Possible momentums are shown in charts.
