Trade ideas

GSFC tightness above 170.70contractions visible in the base. looks ripe for an upmove given the dryness in the volume


GSFC looking bullishGSFC 30 mins chart has flag n pole breakout. Good to buy at 181 for target of 195 with sl below 175

GSFCGSFC:- Head and shoulder pattern has formed, wait for the breakout on the hourly chart, till then keep your eye on the stock.
Hello traders,
As always, simple and neat charts so everyone can understand and not make it too complicated.
rest details mentioned in the chart.
will be posting more such ideas like this. Until that, like share and follow :)
check my other ideas to get to know about all the successful trades based on price action.
Thanks,
Ajay.
keep learning and keep earning.

GSFC Lamba Race Ka GhodaGSFC the moves are impulsive we have first 9 Waves up it could further subdivide in 13 waves will have to wait but any pullback to 155-147 will be good add zone for long term investment.
I am not a SEBI Registered Analyst please consult your advisor before investing charts shared for education purpose only.

May 2023 Study 6: GSFCA chart that I like: GSFC
Reason:
Breakout
High OBV
RS Nifty Divergency
Price within 25% of 52w High
Also,
Golden Cross.

GSFC ready again after pullbackGSFC go long with ur risk management ..After long correction it is not yet confirmed impulse but we are taking risk here anticipating good BO with volume
Triangle breakout 1. Triangle breakout with Volume and Relative strength is in a bullish trajectory
2. Price target estimated about 195 to 205 by next 3-4 month
3. Some pullback is expected at the current price
4. Strong fundamental and Valuation of the stock
5. Target price is overlapping with the previous trend of the stock.
***I am NOT a SEBI registered advisor or a financial adviser. Any of my investment or trades I share are provided for educational purposes only and do not constitute specific financial, trading or investment advice. The post is intended to provide educational information only and does not attempt to give you advice that relates to your specific circumstances.


GSFC - Breaking outGSFC is showing signs of a good breakout.
Wait for the breakout to complete and enter safely, markets are super volatile right now.
Entry - 147
Target - 156.80/169
SL - 135
Study the stock & Trade Responsibly.
Safe Entry - Wait for the breakout & a retest.

GSFC Good long term stockLong on gsfc as budget month buzzing sector fertilizer stock.
this stock is in channel since 2006 in weekly chart only broken downside one time during pandemic and again continued in channel .
target on upside is ₹220 .

GSFC ON MOVEGSFC is giving a good setup on weekly breakout. For short Term Traders , can buy on crossing 153.5 for a target of 163-164.
For Medium to Long Term Investors, we can see a Rounding Bottom Formation on the weekly charts. If it breaks 164, we can see a target of 200- 250.
Volumes are starting to increase also deliverables are at 31% consistently. We may see a breakout soon.
No Recommendation :)
Please Trade after consulting your Financial Adviser.

[Basket] GSFC Gujrat Election BetNote -
One of the best forms of Price Action is to not try to predict at all. Instead of that, ACT on the price. So, this chart tells at "where" to act in "what direction. Unless it triggers, like, let's say the candle doesn't break the level which says "Buy if it breaks", You should not buy at all.
=======
I use shorthands for my trades.
"Positional" - means You can carry these positions and I do not see sharp volatility ahead. (I tally upcoming events and many small kinds of stuff to my own tiny capacity.)
"Intraday" -means You must close this position at any cost by the end of the day.
"Theta" , "Bounce" , "3BB" or "Entropy" - My own systems.
=======
I won't personally follow any rules. If I "think" (It is never gut feel. It is always some reason.) the trade is wrong, I may take reverse trade. I may carry forward an intraday position. What is meant here - You shouldn't follow me because I may miss updating. You should follow the system I share.
=======
Like -
Always follow a stop loss.
In the case of Intraday trades, it is mostly the "Day's High".
In the case of Positional trades, it is mostly the previous swings.
I do not use Stop Loss most of the time. But I manage my risk with options as I do most of the trades using derivatives.
=======

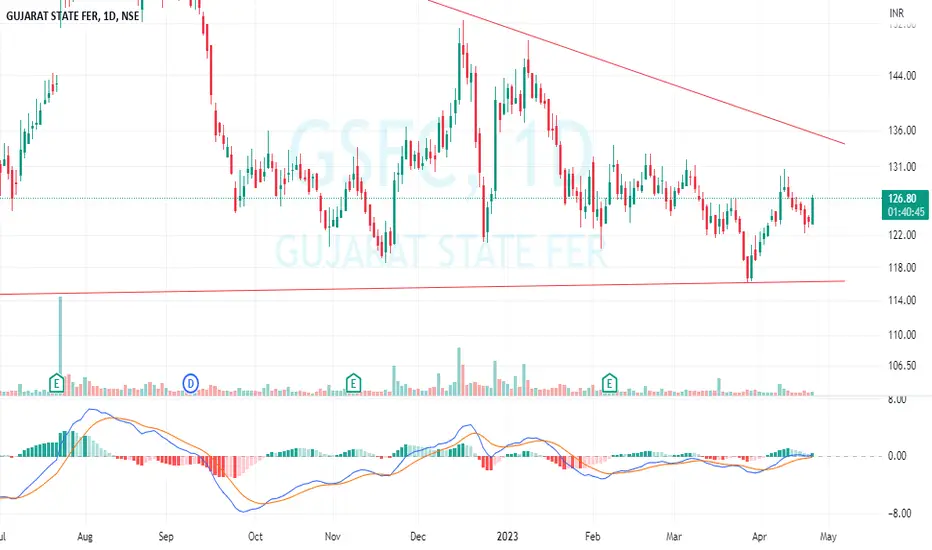
GSFC TARGET 164GSFC under falling wedge monthly strong support. Travels from weekly support to resistance. If it opens above 124 and sustains above the short-term resistance 132 it will reach 164.stop loss 112

Neutral for the momentGSFC respects fib values. Interesting concern on daily, will the Head and Shoulder break down or will the hidden positive divergence of RSI prevale. Long term volume transactions are in the 116 region.


GSFC -- INTRADAY SETUP - 19/05/2022GSFC --INTRADAY SETUP - HOURLY CHART -- 19/05/2022
>> Hourly chart seen trendline breakout Around 155 level last closing candle is breakout candle
>> Daily chart seen trend reversal signal as wave trend crossover to bullish after downtrend
>> RSI at mid range move above 40 level after oversold
BUY GSFC Between 155-157
TARGET 160-162-165
stop loss 150
** THIS IDEA IS FOR EDUCATIONAL PURPOSE ..Trade at own risk .!
HAPPY TRADING . !

