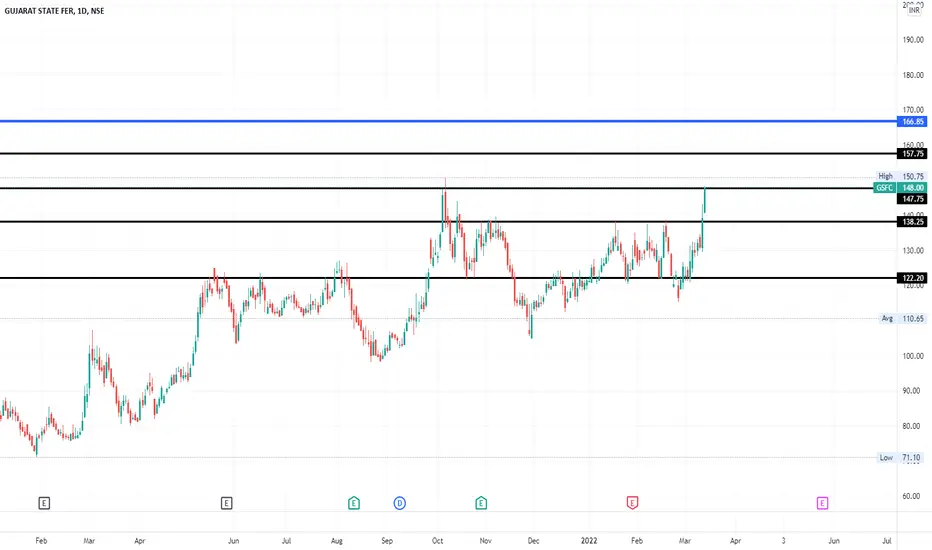
Trendline Breakout in GSFCDON'T HAVE TIME TO MANAGE YOUR TRADES? | Trendline Breakout in GSFC
- Take BTST trades at 3:25 pm everyday
- Book profits within first 30 minutes of the market opening
- Try to exit taking 3-5% profit of each trade
- SL can be taken when 5/15 min candle close below 44EMA
- SL can also be maintained as 1% or closing below the low of breakout candle
Levels mentioned on the chart are calculated using Breakout Indicator
Now why do I prefer BTST over swing trades? The primary reason is that I have observed that 90% of the stocks give most of the movement in just 1-2 days and the rest of the time they either consolidate or fall
Buy Today, Sell Tomorrow: GSFC for more than 5%
Trade ideas

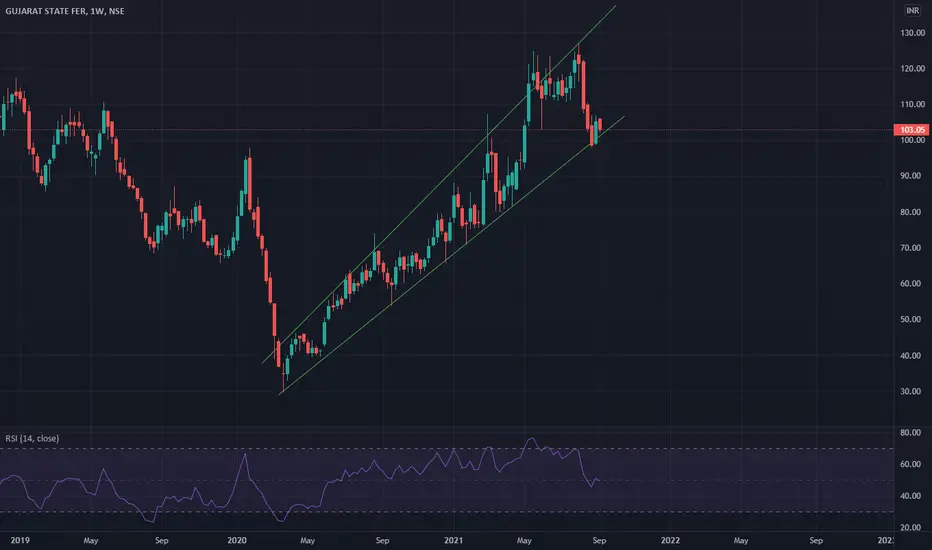
GSFC Weekly Breakout GSFC
Breaking out on weekly time frame
Highest closing on weekly basis after 2018
With GNFC move in last few days, GSFC can rally as well.
Fundamentally well place
At CMP of 139
looking to add in the range of 130-140
with a trading stop loss below 115
For Targets of 160/175/200

GSFC - add to watchlistCrossing WK Piv Upside
Closed above past support Line
Closed above Monthly and Weekly 20 SMA
Also Monthly 20-SMA Crossed Upside 50-SMA
Will test 139 -- but if cross and sustain above this, we will see strong upside
Add to watch list and do own research.

GSFC - Cup and Handle Pattern BreakOut - LongHi All,
This is the Daily frame chart of GSFC - Gujarat State Fertilizers and Chemicals, its formed a Cup and Handle pattern and broken the Handle on 16th Feb with good volume, MACD above zero line and the Cross over happened on the Same day. Now its retesting the breakout area, once it's closed above the 138 price level in the Daily timeframe we can go long.

Swing opportunity !The stock made a good range and tested its resistance zone multiple times.
Looking for a breakout and retest to enter for a swing.
CMP - 133.90.
This is only for educational purpose, Do your own analyze before trade !!!

GSFC LongLooks good for a move up above plotted swing
Disclaimer:
The content of the idea and the interpretation of data are solely my personal views which being said I do not warrant its completeness or accuracy.
This idea published is purely intended for educational and informative purposes, I urge traders to make their own trading decisions based on their specific trading objectives and financial position

GSFCCup and Handle Pattern , First target by this week itself high chance as it already started taking retracement.

Gsfc buyIt will bounce from 110 level. As it is fibonacci 0.786 retracement level and 1 year back support level.

GSFC Multiple Buy Sell, Total Gain More than 70%GSFC Multiple Buy Sell, Total Gain More than 70%
Shared GSFC Multiple buy and sell and total gain is now more than 70%
if it is being bought only once than the total gain will be around 40%.

GSFC : UPTRENDChart Pattern looks good |trend is up |Cross resistence zone 125- 130| Good to go
Buy@ CMP
TGT - 145 & 150
Disclaimer
The analysis is only for illustration purposes only. Please consult your financial advisor, agent, broker before acting on any information. We may or may not have positions in the stock and our actions may be contrary to the one mentioned here. This analysis may or may not be updated. We would not be responsible for the profit/loss resulting from this analysis

Why should we avoid this breakout?This chart gives us few convictions to go long, as there is a
a. Trendline breakout (1.)
b. Volume expansion (6.)
But,
a. It has not come out of the supply zone (4.),
b. It shows a bearish divergence (7.).
c. When we backtest, the morning star pattern created has failed before (2.).
This is NOT investment advice. This chart is meant for learning purposes only. Invest your capital at your own risk.


GSFC BREAKOUTtrendline breakout in GSFC. RSI is a bit on higher side so it might take time to reach the targets. keep the stoploss

GSFC : Bullish to breach highStrong Bullish tend in GSFC.
Disclaimer:
The analysis is only for illustration purposes only. Please consult your financial advisor, agent, broker before acting on any information. We may or may not have positions in the stock and our actions may be contrary to the one mentioned here. This analysis may or may not be updated. We would not be responsible for the profit/loss resulting from this analysis.

GSFC - 3mth Diamond Pattern Breakout w/vol
BUY GUIDANCE:
Never buy before 3PM (for positional trading). I have been burnt many times over. Try to buy between 3:15 - 3:30PM, later the better.
SL: Depending on your risk appetite: Below Weekly BO Candle / Below Daily BO Candle / 50% of Weekly BO candle / Below 20DMA
TGT: After a 10-15%+ vertical move, breakdown of 20DMA (on a daily close basis)
SELL GUIDANCE:
Selling in Profit:
Sell earlier in the session when the prices are higher, around 11AM.
Selling at SL:
Give your stock a chance to recover by end of session. If it doesn't recover, sell anywhere between 3:00 - 3:30PM.
Note: I reserve the right to be wrong.
DISCLAIMER:
I am not a SEBI registered analyst. Please consult your financial advisor before investing.

GSFCDAILY CHART is in strong uptrend and on Friday ,closed near ATH with HUGE volumes. BREAKOUT anytime soon . ADX is also showing bullish uptrend.

Swing Opportunity in GSFCGo Long above 107 for Targets of 111.85, 116.7, and 121.55 with SL 102.15
Reasons to go Long :
1. On a daily timeframe if we draw the Fibonacci retracement tool from recent swing low (point A) to recent swing high (point B) then we see stock took support from 0.618 Fibonacci level.
2. A bullish chart pattern, Double Bottom (W pattern) is formed around 0.618 Fibonacci level.
3. Also there is a strong demand zone (marked with purple color), from which the stock initially faced resistance but now is taking support and moving up.

Weekly Time Frame Bullish view - Wait for ReversalWeekly Time Frame Bullish view - Wait for Reversal
GsfcBuy-99-98
SL-91 Below Daily Closing Basis
Target-112-130
Time Frame- 2 Months
Get Out If The SL Hits..
May Be In Making Of Right Shoulder In H&S..
Enter If Your Risk Suits.

GNFC - But IdeaVCP pattern in play
Overhead Res near 125
If breaks with good volume
Can go long above 125
With Sl below 115


