Trading With AI Is Easy1. AI Simplifies Market Analysis
One of the biggest challenges in trading is understanding the market. Human traders spend hours studying charts, indicators, and historical data. AI solves this challenge by processing vast amounts of information within seconds. Machine learning algorithms can analyze:
Price trends
Volume patterns
Global news
Social media sentiment
Economic indicators
Historical correlations
This allows AI systems to provide a deeper and more accurate view of market conditions. Instead of manually reading dozens of charts, traders simply rely on AI-generated insights that highlight trends, warn of risks, and predict probable outcomes. This drastically reduces the time and effort required to make decisions.
2. AI-Powered Predictions Improve Accuracy
AI excels at recognizing patterns that humans often overlook. Advanced models such as neural networks observe millions of data points simultaneously and forecast price movements based on probability. Although AI cannot guarantee 100% accuracy, it significantly improves the reliability of predictions compared to traditional manual analysis.
For example:
AI can identify early signs of trend reversals before they appear clearly on charts.
Predictive algorithms can estimate the strength of momentum, volatility, and breakout potential.
Sentiment analysis tools can detect market mood shifts in real time.
These capabilities help traders make more informed decisions and avoid emotional pitfalls like fear, greed, and panic.
3. Automation Makes Trading Easier
AI's greatest advantage lies in automation. Automated trading—often called algorithmic trading—uses AI systems to execute trades without human intervention. Traders simply set the rules, and the AI executes them flawlessly. This leads to:
Faster order execution
Reduced slippage
Removal of emotional bias
Consistent performance
24/7 trading even when the trader is offline
Automated systems handle multiple indicators, timeframes, and markets simultaneously, something humans cannot manage manually. This makes trading easier and more efficient for both beginners and professionals.
4. AI Helps Eliminate Emotional Trading
Humans are naturally influenced by emotions such as fear, hope, and excitement. These emotions often lead to bad decisions—entering trades too early, exiting too late, or over-trading.
AI, on the other hand, is emotionless.
It operates purely on data and logic, ensuring:
Discipline
Consistency
Accuracy
Strict adherence to strategy
This helps traders avoid common psychological traps and maintain a stable, long-term approach.
5. AI Reduces the Learning Curve
For beginners, trading can feel overwhelming. Understanding technical indicators, chart patterns, and market fundamentals usually requires months of learning. AI tools simplify this process by offering:
Ready-made strategies
Automated signals
Visual dashboards
Clear buy/sell suggestions
Real-time risk assessment
Instead of learning everything manually, traders can rely on AI tools to guide them. This shortens the learning curve and makes trading accessible even to those without deep financial knowledge.
6. AI Enhances Risk Management
Risk management is the foundation of successful trading. Many traders fail not because their strategy is wrong, but because their risk management is weak. AI enhances risk control by:
Automatically adjusting position sizes
Setting optimal stop-loss and take-profit levels
Predicting potential drawdowns
Detecting high-risk market conditions
Avoiding trades during unpredictable volatility
AI’s ability to quantify and manage risk makes trading far safer and more predictable.
7. Real-Time Market Monitoring
Markets change quickly. A sudden news event can cause massive price movements. No human can monitor markets every second, but AI can. It constantly scans:
Charts
Data feeds
News
Economic calendars
Sentiment trends
AI then instantly alerts traders or automatically executes strategies. This ensures traders never miss opportunities or fail to react during major events.
8. AI Provides Personalized Trading Experience
Modern AI tools learn from each trader’s behavior. They adjust based on:
Trading style
Risk tolerance
Preferred markets
Timeframe selection
Past performance
This personalization creates a trading system that evolves over time and becomes smarter every day. Beginners get guidance, while experienced traders get advanced insights tailored to their strategies.
9. AI Supports All Markets
AI is not limited to one market. It works across:
Stocks
Forex
Cryptocurrencies
Commodities
Indices
Derivatives (options & futures)
The same AI engine can track global markets simultaneously, giving traders a diversified edge.
10. Backtesting and Strategy Optimization Become Easy
Before using a trading strategy, it must be tested. AI makes this easy by running backtests using years of historical data. It can simulate thousands of trades within minutes. Traders can instantly see:
Profit and loss potential
Drawdowns
Win rate
Strategy performance in different market conditions
AI can also fine-tune strategies by optimizing parameters automatically, producing better results over time.
11. Time-Saving and Efficient
Trading used to require hours of chart analysis daily. With AI:
Daily analysis takes seconds
Signals are instant
Trades can run automatically
Risk is calculated in real time
This allows traders to maintain their career, studies, or business while trading part-time or passively.
12. AI Levels the Playing Field
Earlier, only big institutions had access to advanced tools. Now AI technology is widely available through:
Trading platforms
Mobile apps
Cloud-based systems
Retail AI bots
Online broker tools
This gives small traders the same processing power previously available only to hedge funds.
Conclusion: Trading With AI Is Easier, Smarter, and More Accessible
AI does not eliminate all risks, and it does not guarantee profits. But it dramatically simplifies the entire process of trading by providing:
Deep market insights
Advanced predictions
Automated decision-making
Personalized strategies
Emotion-free execution
24/7 monitoring
Optimized performance
Trading will always involve uncertainty, but with AI, traders can navigate markets with far more confidence, clarity, and efficiency. AI has changed trading forever—making it easier, smarter, and more accessible for everyone.
Trade ideas

Rejection. Divergence. Confirmation? A Short Setup EmergingFeature, Detail
Price Signal: Shooting Star at the peak, showing clear rejection of higher prices and buyer exhaustion
Momentum Signal: Bearish RSI divergence — price made a higher high while RSI formed a lower peak
Consensus: Reversal candle + momentum divergence creates a high-probability pullback setup
Current Price: Trading near the 52-week high of ₹2,011, making the rejection zone psychologically significant
Bias: Short-term correction favored
Action: Enter only after confirmation — a daily close below the Shooting Star’s body
Invalidation (SL): A close above the Shooting Star high negates the bearish setup
Disclaimer: Educational only. DYOR.

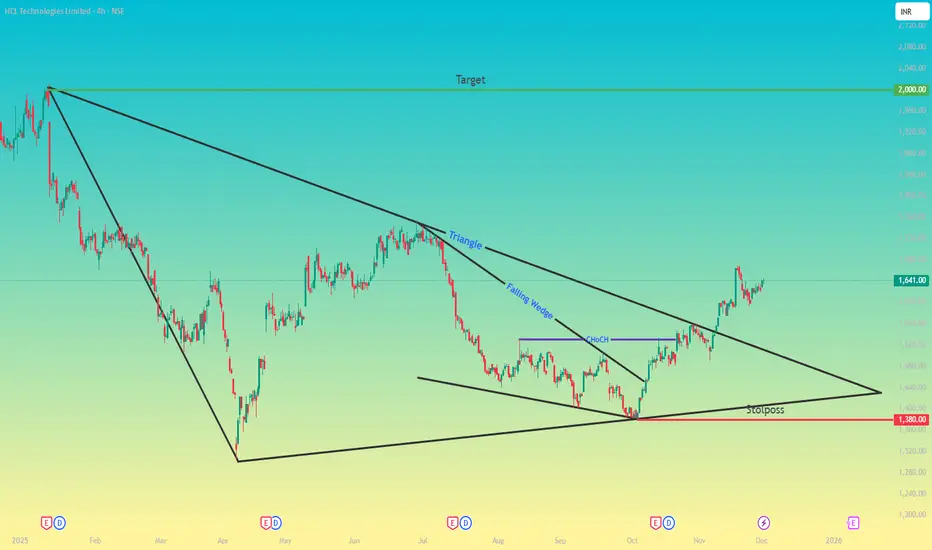
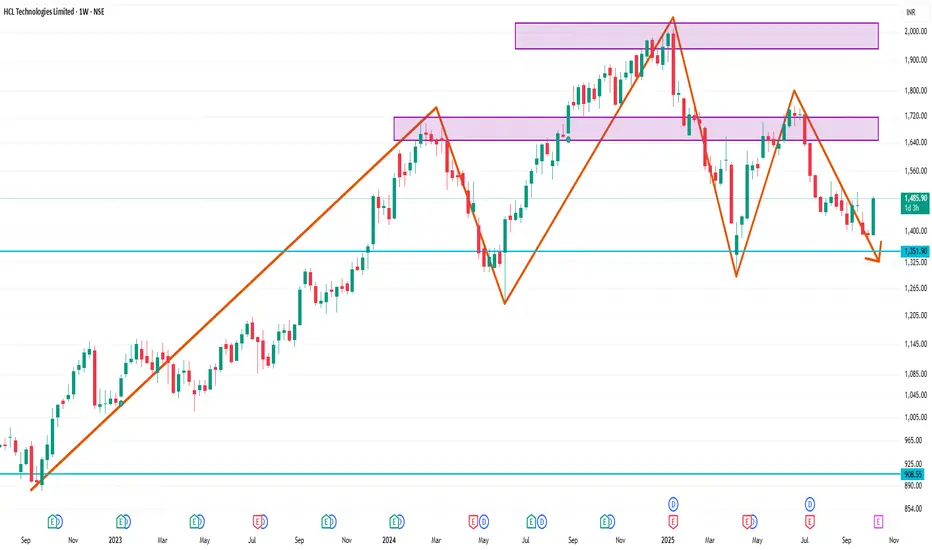
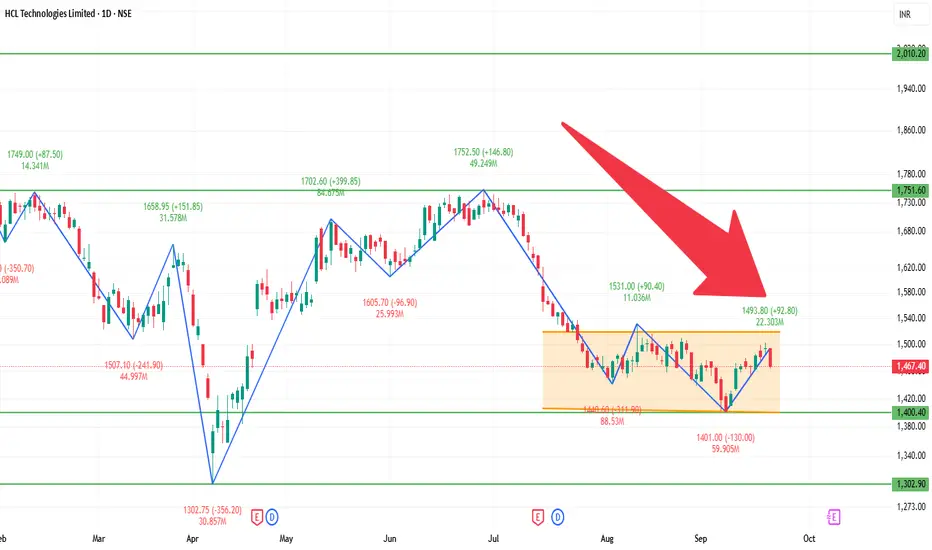
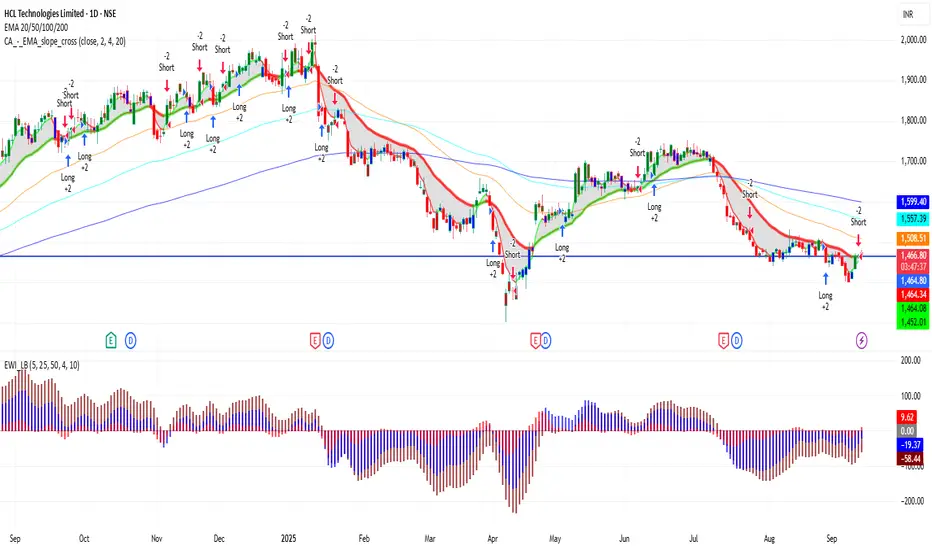
HCLTECH –A Complete Structural Shift After Months of CompressionHCLTECH spent several months inside a broad falling structure, creating a steady sequence of lower highs and lower lows. But within this decline, the market slowly began forming a triangle and later a falling wedge, both of which signaled weakening selling pressure.
The major turning point came when price respected the lower wedge support and produced a strong rally, giving us a clear Change of Character (CHoCH). This move showed that buyers were starting to regain control.
The most important development was the break of the macro descending trendline, which had guided the entire downtrend since early 2025. This break marks the beginning of a higher-timeframe reversal.
With structure now flipped bullish, the chart opens the path toward the next major supply zone near ₹2000, which remains the logical upside target. The setup stays valid as long as price holds above ₹1380, the critical support and invalidation level.
HCLTECH has transitioned from a long period of compression into a confirmed breakout, and momentum now favors continued upside.
Best Timeframes for Riding Momentum1. Understanding Momentum Across Timeframes
Momentum is not equal on all charts. A stock may show momentum on a 5-minute chart due to a news spike, while the daily chart might show a strong trend reversal building over days or weeks. Therefore, selecting a timeframe is essentially choosing the type of momentum you want to ride:
Short-term momentum (scalping/intraday)
Medium-term momentum (swing trading)
Long-term momentum (positional/trend trading)
The key is to match your risk appetite, capital, and trading frequency with the correct timeframe.
2. Best Timeframes for Intraday Momentum Trading
Intraday momentum traders rely on speed, volume bursts, volatility expansions, and breakouts. These traders prefer timeframes that show quick moves and real-time strength.
(a) 1-Minute Chart (For Aggressive Scalpers)
The 1-minute chart captures the earliest shift in momentum. Traders who use this timeframe look for:
Quick breakouts
Volume surges
Rapid candles indicating imbalance
Small pullbacks in a fast trend
Pros:
Very early entry
Ideal during news events or opening volatility
Cons:
High noise
Requires fast decision-making
Stops can get hit easily
This timeframe suits only experienced, disciplined scalpers.
(b) 5-Minute Chart (Most Popular for Intraday Momentum)
The 5-minute chart is the most widely used for riding intraday momentum because it balances speed with reduced noise.
You can spot:
Breakouts with confirmation
Momentum continuation patterns
Clean trend waves
Strong candles backed by volume
Pros:
Good for capturing 30-minute to 2-hour momentum bursts
Less noise than 1-minute
Ideal for most intraday strategies
Cons:
Might give slightly late signals compared to 1-minute
For 90% of intraday momentum traders, this is the most effective timeframe.
(c) 15-Minute Chart (For Stable Intraday Momentum)
The 15-minute timeframe filters out small fluctuations and highlights more stable trends.
Traders use it to capture:
Structured trend continuation
Breakouts that sustain
Market-wide directional moves (index-based momentum)
Pros:
Cleaner momentum signals
Higher probability of trend continuation
Ideal for traders who don’t want to react to every tick
Cons:
May miss early entries
Momentum moves may already be halfway over
This timeframe is preferred by traders who want moderately fast but reliable moves.
3. Best Timeframes for Swing Momentum Trading
If you want to capture momentum lasting days to weeks, swing timeframes are ideal. Momentum on these charts often aligns with:
Strong fundamental triggers
Trend reversals
Breakouts from long consolidations
Institutional buying/selling
(a) 1-Hour Chart (Great for Short-Term Swings)
The 1-hour (H1) chart helps identify momentum trends that last 1–3 days.
Momentum here is typically caused by:
Overnight sentiment continuation
Market-wide setups
Sector rotations
Breakout retests
Benefits:
Captures multi-day momentum waves
Smoother trends vs. intraday charts
Works well for stocks, forex, crypto, and commodities
This timeframe is a bridge between intraday and swing trading.
(b) 4-Hour Chart (Most Reliable for Multi-Day Moves)
The 4-hour (H4) timeframe is considered one of the most powerful charts for swing momentum trading.
Here, momentum reflects:
Medium-term investor flows
Strong technical patterns
Higher probability breakouts
Why it works so well:
Less noise
Strong price follow-through
Institutional influence becomes visible
Most swing traders rely on H4 + Daily to ride big moves.
(c) Daily Chart (D1) — King of Momentum Trading
The daily chart generates the most reliable momentum signals. Moves generated here can last for:
Weeks
Months
Quarters
Daily momentum is driven by:
Strong fundamentals
Earnings
Policy changes
Market trends
Institutional accumulation or distribution
Pros:
Very high accuracy
Fewer false breakouts
Clear, powerful trends
Cons:
Requires patience
Larger stop-losses
Fewer trades (but higher quality)
If your goal is long-term, stable momentum riding, D1 is the best.
4. Best Timeframes for Positional Trend-Momentum Trading
Longer timeframes show macro momentum, ideal for investors who want to ride multi-month or multi-year trends.
(a) Weekly Chart (W1)
The weekly timeframe captures strong themes such as:
Sector trends
Commodity supercycles
Long-term breakouts
Market phases (bull/bear transitions)
Weekly momentum is extremely powerful because it represents consistent institutional buying across many weeks.
(b) Monthly Chart (MN)
The monthly chart is used for major momentum moves like:
Market cycles
Structural bull markets
Long-term investment themes
Momentum here unfolds slowly, but the moves are massive.
5. Combining Timeframes: The Secret to Riding Momentum Safely
The best traders use multi-timeframe analysis:
High timeframe = Trend direction
Lower timeframe = Entry timing
Example:
Daily chart → shows strong bullish trend
4-hour chart → shows breakout or pullback
15-minute chart → provides perfect entry
This lets you:
Avoid false signals
Trade in the direction of major forces
Enter with precision
6. Which Timeframe Is Best for YOU?
Your timeframe should match your personality and availability:
Trader Type Best Timeframes
Scalper 1m, 5m
Intraday Momentum Trader 5m, 15m
Swing Trader 1h, 4h, Daily
Positional Momentum Investor Weekly, Monthly
Ask yourself:
Do you want fast gains? → Lower timeframes
Do you want dependable momentum? → Higher timeframes
Do you want fewer but bigger moves? → Daily–Weekly
7. Key Indicators That Work Across All Timeframes
To ride momentum effectively, pair your chosen timeframe with:
RSI (overbought/oversold momentum strength)
MACD (momentum direction & crossover)
Moving Averages (20/50/200 EMA)
Volume (confirm strength)
VWAP (intraday only)
Momentum is strongest when:
Price > 20 & 50 EMA
Volume spike confirms breakout
RSI stays above 60 (bull) or below 40 (bear)
Conclusion
The best timeframe for riding momentum depends on your trading style, but the most reliable ones are:
5m for intraday
1h & 4h for swing
Daily for long-term momentum
Understanding how momentum behaves across timeframes allows you to enter earlier, stay confident in the trend, manage risk better, and maximize profits.
HCLTECH - Trendline breakout
BUY at current level 1570 (average on dips or after retest the trend line)
Targets 1658, 1740.
Support / SL below 1510 (DAILY CLOSE)

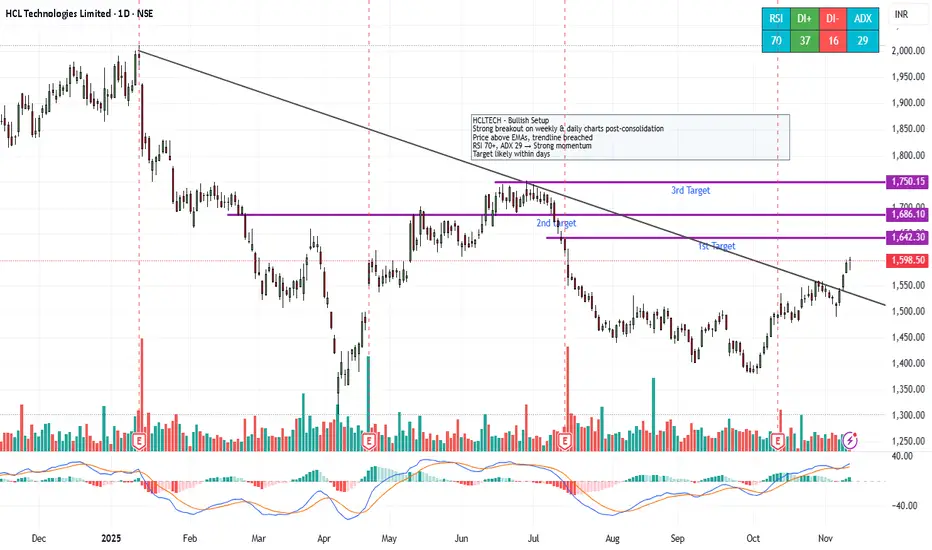
HCLTECH - Good time to bullish with quick profitBullish Setup
Strong breakout on weekly & daily charts post-consolidation
Price above EMAs, trendline breached
RSI 70+, ADX 29 → Strong momentum
Target likely within days
HCLTECH 1 Week Timw Frame📈 1-Week Performance Overview
Current Price: ₹1,539.50
Weekly Change: +1.41%
52-Week High: ₹2,012.20
52-Week Low: ₹1,302.75
Market Cap: ₹4.14 trillion
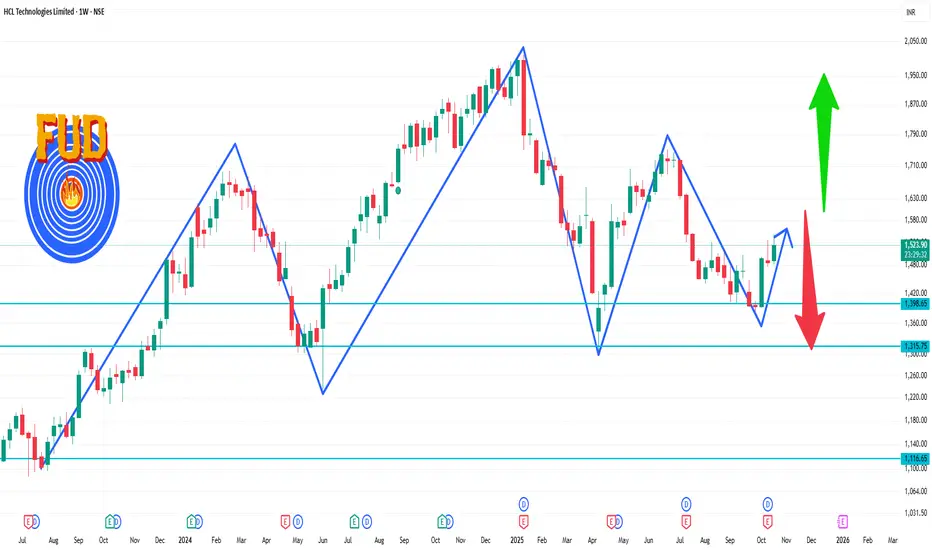
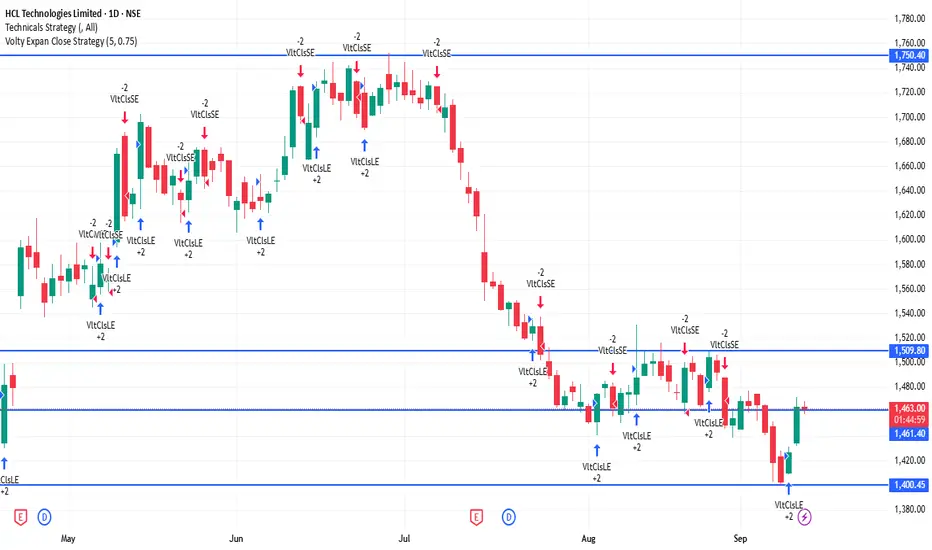
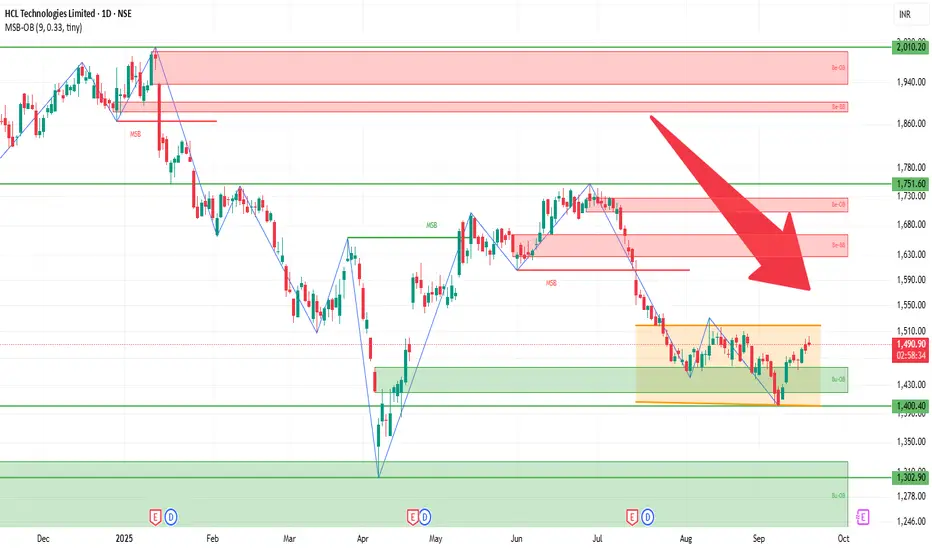
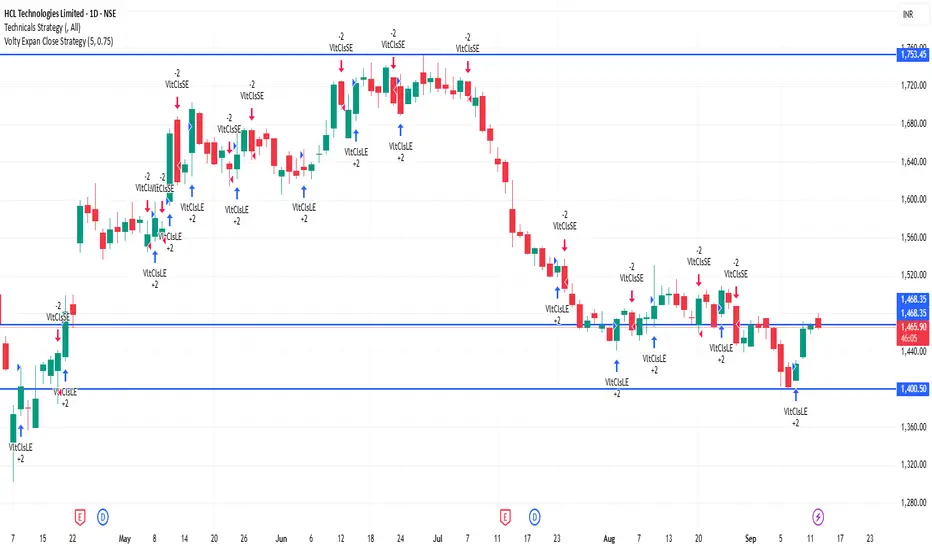
HCLTECHsupply zone is between 1660 to 1760
demand zone is between 1380 to 1470
currently stock is in bearish mood
best level to buy is 1460

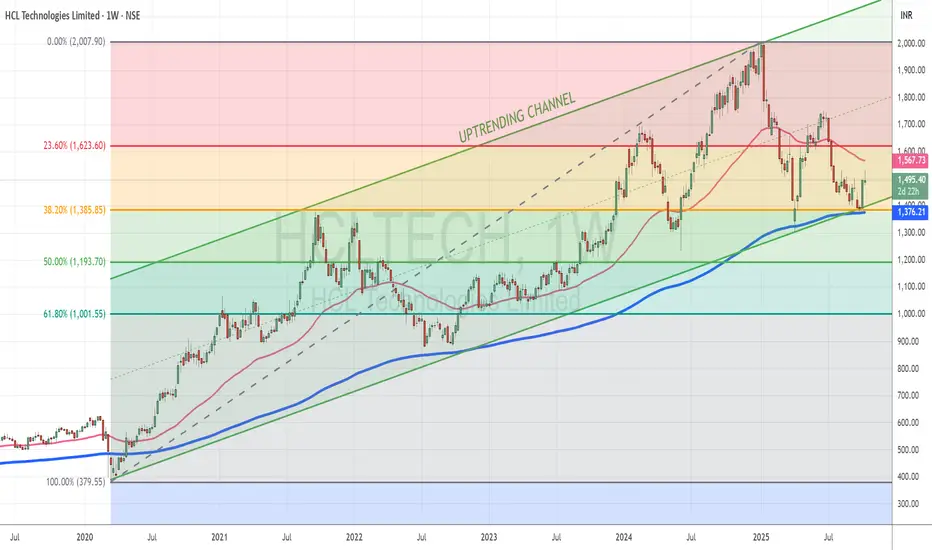
HCLTech shows signs of reversal after global-policy-driven correTopic Statement:
HCLTech, like other IT peers, has been dragged down by global economic policies but now shows early signs of recovery from key support levels.
Key Points:
1. The stock corrected down to the 38.2% Fibonacci retracement level at 1385, where it found strong support
2. Price reversed after touching the lower boundary of its bullish channel, reinforcing the trend structure
3. Currently trading below the 50-day EMA, the stock is oversold in the short term and presents a possible accumulation opportunity
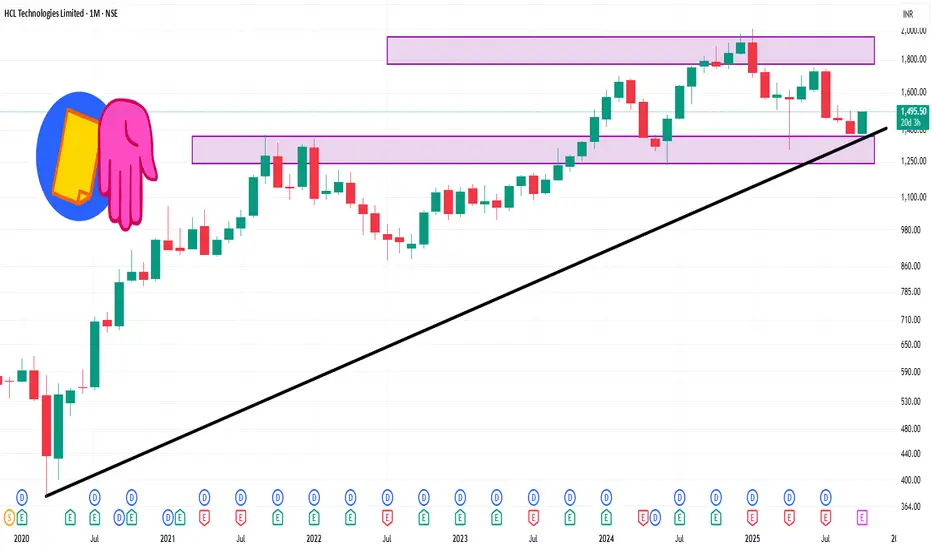
HCLTECH 1 Month Time Frame 📈 1-Month Performance Overview
Current Price: ₹1,495.50
1-Month Change: +4.19%
52-Week Range: ₹1,302.75 – ₹2,012.20
Market Capitalization: ₹4,05,612 crore
P/E Ratio (TTM): 23.88
Dividend Yield: 4.02%
Over the past month, HCL Technologies has shown a steady upward trend, outperforming the Nifty IT Index, which has gained approximately 0.33% during the same period.
📊 Technical Snapshot
1-Month High: ₹1,502.90
1-Month Low: ₹1,380.40
Average Price: ₹1,443.09
Price Change: +2.16%
Risk Management vs Position Sizing in Option Trading1. Introduction to Risk Management in Option Trading
Risk management refers to the strategies and techniques traders use to minimize potential losses and protect their capital. In simple terms, it’s the process of deciding how much risk you are willing to take on each trade and how to respond when the market moves against you.
Option trading is inherently riskier than traditional stock trading because of leverage, time decay, and volatility sensitivity. Without a sound risk management plan, even the most skilled traders can wipe out their capital quickly.
Key Objectives of Risk Management
Capital Preservation – Protect your trading capital from large drawdowns.
Consistent Returns – Maintain a stable equity curve with controlled risk exposure.
Psychological Stability – Reduce emotional stress by limiting large unexpected losses.
Longevity in the Market – Survive long enough to benefit from the law of large numbers and experience.
2. Importance of Risk Management in Options
Options are leveraged instruments, meaning small price changes in the underlying asset can result in large percentage gains or losses in the option’s value. This amplifies both potential profits and potential risks.
Consider this scenario:
You buy a call option for ₹100 (premium) on NIFTY.
If NIFTY moves in your favor, the option could rise to ₹200 — a 100% return.
If NIFTY falls, your option could drop to ₹20 or even expire worthless — an 80–100% loss.
Without managing your risk per trade, such swings can lead to emotional trading, over-leveraging, and account blowouts.
Core Components of Option Risk Management
Defining Maximum Risk Per Trade – Most professionals risk 1–2% of total capital per trade.
Setting Stop-Loss Levels – Determine the exit point where losses are capped.
Diversification – Spread exposure across different stocks, sectors, or strategies.
Volatility Consideration – Manage trades based on implied and historical volatility levels.
Risk-Reward Ratio – Ensure that the potential reward is at least twice the risk (2:1 ratio).
Hedging – Use opposite positions (like protective puts) to reduce overall portfolio risk.
3. The Relationship Between Risk Management and Position Sizing
Risk management and position sizing are two sides of the same coin.
Risk management answers “How much can I afford to lose?”
Position sizing answers “How big should my trade be?”
Key Relationship:
Risk per trade defines the maximum acceptable loss.
Position sizing translates that risk into number of contracts.
Together, they ensure that no single trade can cause significant damage to your account, maintaining capital stability and emotional discipline.
4. Why Traders Fail Without These Concepts
Most new option traders focus entirely on predicting market direction, ignoring money management. They trade too large, too often, and without structured risk control.
Common reasons for failure include:
Over-leveraging (too many lots for account size)
No stop-loss or adjustment strategy
Risking inconsistent amounts per trade
Emotional revenge trading after losses
Ignoring volatility and time decay
By applying consistent position sizing and risk management rules, traders can survive losing streaks and remain profitable long-term, even with a win rate as low as 40–50%.
5. Types of Risks in Option Trading
Before applying risk management, traders must understand the different types of risks involved in option trading:
a. Market Risk
The risk of losing money due to adverse price movements in the underlying asset.
b. Volatility Risk
Changes in implied volatility (IV) affect option premiums. A sudden drop in IV can cause losses even if the price moves favorably.
c. Time Decay Risk (Theta)
Options lose value over time, especially as they approach expiry. Holding long options without movement can lead to gradual losses.
d. Liquidity Risk
Low open interest or volume can make it difficult to exit positions at fair prices.
e. Execution Risk
Delays or slippages during trade entry or exit can increase actual losses beyond planned levels.
Understanding these risks helps traders plan position size and protective measures accordingly.
6. Risk Management Techniques in Option Trading
a. Use of Stop-Loss Orders
Set stop-loss levels based on technical indicators, volatility bands, or fixed percentage loss.
Example: Exit if the option premium drops 30–40% below entry.
b. Hedging Positions
Offset risk with opposite positions:
Long stock + long put = protective hedge
Short call + long call (spread) = limited loss
c. Strategy Selection
Use defined-risk strategies like spreads, straddles, and butterflies instead of naked options. This caps potential losses upfront.
d. Diversification Across Trades
Avoid placing all capital on a single stock or index. Diversify across:
Different sectors
Expiry dates
Strategy types (e.g., spreads, iron condors, strangles)
e. Portfolio Risk Management
Monitor total portfolio exposure instead of individual trades.
Limit total open risk to no more than 10–15% of trading capital.
7. Psychological Role of Risk and Position Sizing
Trading psychology plays a significant role in executing these principles. When traders know their maximum loss upfront, it reduces anxiety and prevents panic decisions.
Proper position sizing allows traders to trade objectively, even during volatile periods.
Benefits include:
Increased confidence
Better emotional control
Reduced overtrading
More consistent performance
Advanced Risk Management Tools for Option Traders
Greeks Management – Use delta, gamma, theta, and vega to manage exposure dynamically.
Portfolio Margining – Optimize capital usage by evaluating net exposure.
Scenario Analysis – Simulate market movements and estimate potential losses.
Stop-Loss Automation – Use algorithmic or rule-based systems to exit losing trades swiftly.
Volatility Filters – Avoid trading during excessive volatility or major news events.
8. The Compounding Power of Controlled Risk
Consistent position sizing with controlled risk leads to geometric capital growth.
For example, if you risk 1% per trade with a 2:1 reward-to-risk ratio and maintain 50% accuracy, your capital will grow steadily.
The Math Behind It
Over 100 trades:
50 winners × 2% gain = +100%
50 losers × 1% loss = -50%
Net Gain = +50% with disciplined risk and sizing
This demonstrates that consistent risk management is more important than win rate.
9. Common Mistakes to Avoid
Risking too much on one trade
Ignoring correlation between positions
Overtrading after a winning streak
Refusing to cut losses early
Neglecting volatility effects on options
Avoiding these mistakes ensures steady progress and capital safety.
10. Integrating Risk Management & Position Sizing into a Trading Plan
A professional trading plan should include:
Defined capital allocation for each strategy.
Maximum risk per trade and per day/week.
A clear position sizing formula.
Stop-loss and target guidelines.
Rules for scaling in/out of trades.
Performance review metrics (risk-adjusted returns).
Conclusion
Risk management and position sizing are the twin pillars of success in option trading. While strategy selection determines what to trade, risk management determines how much to trade and how to survive in the long run.
A trader who risks 1–2% per trade and sizes positions properly can withstand market volatility, endure losing streaks, and steadily grow wealth through compounding.
Ultimately, trading is not about predicting the future — it’s about managing uncertainty. The traders who master risk and position sizing don’t just survive — they thrive.
HCLTECH 1 Week Time Frame📈 1-Week Performance Overview
Current Price: ₹1,480.00 (as of October 9, 2025)
Weekly Gain: Approximately 6.51%
📊 Recent Trading Highlights
October 8, 2025: Closed at ₹1,452.85, up 1.34% from the previous day, outperforming the BSE SENSEX Index, which declined by 0.19%.
October 7, 2025: Closed at ₹1,433.65, marking a 1.20% increase, with the SENSEX Index rising by 0.17%.
October 3, 2025: Closed at ₹1,393.25, up 0.27%, while the SENSEX Index gained 0.28%.
📉 52-Week Range
52-Week High: ₹2,011.00 (January 13, 2025)
52-Week Low: ₹1,302.75
Current Price: ₹1,480.00
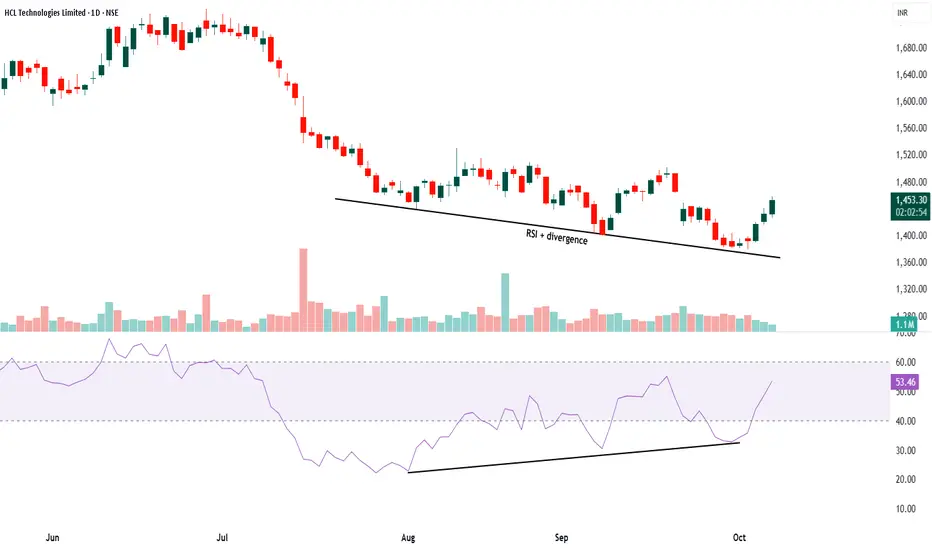
HCL TECH - RSI positive divergenceRSI positive divergence is a powerful technical analysis signal that indicates a potential trend reversal from bearish to bullish. Here's a simple step-by-step explanation for your community members:
Understand RSI: The Relative Strength Index (RSI) measures the speed and change of price movements on a scale of 0 to 100. Values below 40 typically indicate an oversold market, while values above 60 suggest an overbought market.
Spot the price trend: Look at the stock price chart. If the price is making lower lows (falling prices) over time, it indicates a downtrend.
Observe the RSI behavior: While the price is making lower lows, check the RSI indicator below the price chart. In RSI positive divergence, the RSI makes higher lows.
What is RSI positive divergence? It's when the price hits new lows, but RSI doesn't follow and instead forms higher lows. This shows weakening selling pressure and suggests buyers may soon take control.
Interpretation: RSI positive divergence signals the existing downtrend may be losing momentum, making it likely for the price to reverse upwards.
Confirmation: Traders often wait for additional bullish signals or a price breakout to confirm the reversal before entering long positions.
HCLTECH 1D Time frameOpening Price: ₹1,387.40
Closing Price: ₹1,387.40
Day Range: ₹1,383.10 – ₹1,395.00
Previous Close: ₹1,387.40
📉 Trend Analysis
Short-Term Trend: Bearish — The stock is trading below key moving averages, confirming the bearish trend.
Medium-Term Trend: Neutral — The stock is in a consolidation phase, characterized by lower highs and lower lows.
Long-Term Trend: Neutral — No significant trend identified; the stock is trading within a range.
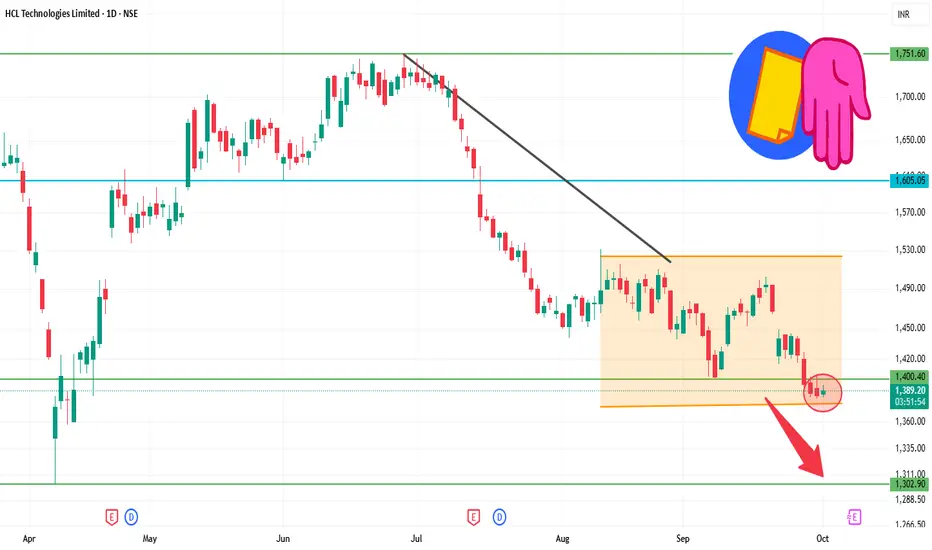
HCL Technologies.HCL Technologies is currently consolidating after a sharp correction and has formed a base near the buy zone of 1414–1301. The stock has broken out of its downtrend line and is showing early signs of reversal.
View: Bullish reversal in progress. Accumulation in the buy zone with strict SL offers favorable risk-to-reward. A breakout above 1503 can trigger momentum towards higher targets.
1st Target: 1503 (immediate resistance & breakout level)
2nd Target: 1673 (measured move after breakout)
3rd Target: Previous swing high zone (around 1800+)
Stop Loss: Close below 1414 (buy zone invalidation).

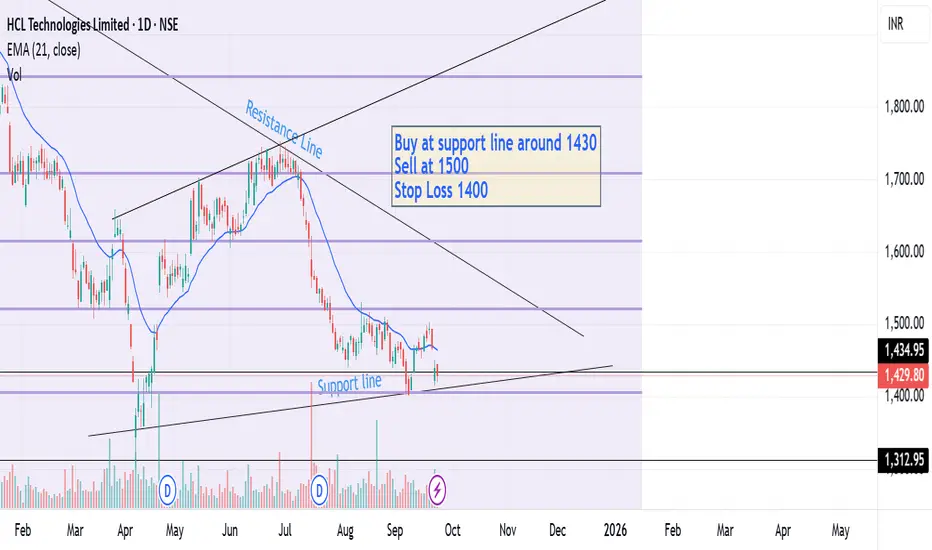
Stock near Support. Definite BuyBuy and SL and Target prices mentioned. This is a conservatinve trade.
Fib retracement and support resistance lines are drawn. Also in Weekly timeframe the price is away from EMA21 line below. it also indicates the price wiull move up.
HCLTECH 1D Time frame📊 Current Overview
Price is trading near ₹1,460 – ₹1,470 range.
Trend on the daily chart is showing weakness.
Stock is trading below most key moving averages (50-day, 100-day, 200-day).
🔍 Support & Resistance
Immediate Support: ₹1,450
Next Support: ₹1,430 – ₹1,420
Immediate Resistance: ₹1,470 – ₹1,475
Higher Resistance: ₹1,490 – ₹1,500
📈 Indicators
RSI (14): Neutral to slightly bearish, around mid-40s.
MACD: Weak, showing bearish crossover or flat momentum.
Trend: More sideways to bearish unless resistance levels break.
🎯 Possible Scenarios
Bullish: If HCLTECH breaks and sustains above ₹1,475, it could target ₹1,490 – ₹1,500.
Bearish: If it fails and slips below ₹1,450, it may fall towards ₹1,430 – ₹1,420.
HCLTECH 1D Time frameCurrent Picture
Share price is ~ ₹1,499-₹1,505.
Recent momentum has been upward; the stock is trading above most moving averages—short-, medium-, and long-term.
Indicators are generally favoring continuation of the uptrend.
⚙️ Indicators / Momentum
Many oscillators (RSI, MACD, CCI etc.) are in bullish territory.
Moving averages from 5-, 10-, 20-, 50-, 100- to 200‐day are all aligned bullish (price above them).
Volatility is moderate to high — good movement, but also risk of pullbacks.
📌 Key Support & Resistance Levels
Immediate Resistance: around ₹1,505-₹1,515.
Immediate Support: near ₹1,480-₹1,490.
Stronger support further down around ₹1,400-₹1,420 in case of sharper correction.
✅ Outlook & Risks
Short term bias is bullish as long as price holds above the immediate support (≈ ₹1,480).
If resistance around ₹1,510 breaks decisively, more upside is likely.
HCLTECH 1D Time frameUpdated Snapshot
Current Price: ₹1,466
Day’s Range: ₹1,452 – ₹1,467
Previous Close: ₹1,467.20
🔹 Support & Resistance
Support 1: ₹1,452 – ₹1,450
Support 2: ₹1,430 – ₹1,420
Resistance 1: ₹1,470 – ₹1,475
Resistance 2: ₹1,490 – ₹1,500
HCLTECH 1D Time frame📉 Current Market Snapshot
Current Price: ₹1,467
Previous Close: ₹1,467.20
Day’s Range: ₹1,463 – ₹1,480
📊 Key Support & Resistance Levels
Support Levels: ₹1,463, ₹1,450
Resistance Levels: ₹1,480, ₹1,500
HCLTECH 1D Time frame🔢 Current Level
Trading around ₹1,465.80 - ₹1,467.80
🔑 Key Resistance & Support Levels
Resistance Zones:
₹1,472 – ₹1,475 (recent highs; breakout above this may lead to further upside)
₹1,485 – ₹1,490 (stronger resistance above)
Support Zones:
₹1,460 – ₹1,463 (immediate support; failure to hold above this may lead to a decline)
₹1,450 – ₹1,453 (short-term support; a break below this could indicate weakness)
₹1,440 – ₹1,445 (deeper support zone if price dips further)
📉 Outlook
Bullish Scenario: If HCL Technologies holds above ₹1,463, upward momentum may continue. Break above ₹1,475 can open the way toward ₹1,485+.
Bearish Scenario: If it falls below ₹1,440, risk increases toward ₹1,430 – ₹1,445.
Neutral / Range: Between ₹1,463 – ₹1,475, HCL Technologies may consolidate before a directional move.
HCLTECH 1D Time frame🔢 Current Level
Trading around ₹1,465 – ₹1,470
🔑 Key Resistance & Support Levels
Resistance Zones:
₹1,476 – ₹1,480 (near-term resistance; breakout above this may lead to further upside)
₹1,494 – ₹1,520 (stronger resistance above)
Support Zones:
₹1,460 – ₹1,463 (immediate support; failure to hold above this may lead to a decline)
₹1,450 – ₹1,460 (short-term support; a break below this could indicate weakness)
₹1,431 – ₹1,440 (deeper support zone if price dips further)
📉 Outlook
Bullish Scenario: If HCL Technologies holds above ₹1,463, upward momentum may continue. Break above ₹1,480 can open the way toward ₹1,494 – ₹1,520.
Bearish Scenario: If it falls below ₹1,450, risk increases toward ₹1,431 – ₹1,440.
Neutral / Range: Between ₹1,463 – ₹1,480, HCL Technologies may consolidate before a directional move.
HCLTECH 1D Time frame📍 Current Price Action
HCLTECH is trading around ₹1,464.
Day’s low is near ₹1,458, and high is around ₹1,470.
The stock is consolidating near the upper end of its intraday range.
⚖️ Key Levels
Immediate Resistance: ₹1,470 – ₹1,475
Next Resistance: ₹1,495 – ₹1,500
Immediate Support: ₹1,450
Strong Support: ₹1,430 – ₹1,420
📊 Indicators
Moving Averages: Short-term MAs (5-, 10-day) slightly lagging, medium-term (20-, 50-day) supportive → trend mildly bullish.
RSI (14-day): Around 66 → showing bullish momentum, approaching overbought.
MACD: Positive, indicating mild bullish bias, but momentum is not extremely strong.
📈 Outlook
If HCLTECH holds above ₹1,450, potential upside toward ₹1,470 – ₹1,495 exists.
A breakout above ₹1,475 could open room toward ₹1,500.
On the downside, a drop below ₹1,450 may test ₹1,430 – ₹1,420 support.
Overall bias: Slightly bullish, but caution near resistance.