HCL TECHHCLTECH - Short Term Trade
A good Tringle Pattern Breakout Possibility..
Buy Above - 1156
SL = 1100
Target = 1206 / 1300
HCLTECH trade ideas

HCL TECH looking bullishGood volume and results coming up!
Lets buy here for atleast 5% returns!
Hoping for the best!

HCL Range breakout ? Deep dive analysis Key analysis:
• Stock has been forming Lower High || Lower Low formation until October 2022
• Formed a strong base by testing the same level twice and reversed with good market participation
• Made a tremendous move up until December 2023 and has been in range since then
• Interesting point to note is that the last move from range high to range low has taken a good 73 calendar days (46 trading days), however with CMP almost near to range high the move from range low to CMP has just taken 42 calendar days (29 trading days). This indicates healthy momentum with possible strong buying taking place.
• Healthy market participation is being observed every time the stock touch the range low with heavy lifting being done
• Strong money flow is being observed from March 2023 indicating good buying taking place (even during minor corrections)
• Time cycles are also in sync with the last Trough-Peak-Trough (TPT), approximately 139 calendar days
***A break out from the zone here could possible trigger a good move up ***

HCL Tech Short term trade (Long)Falling Wedge Pattern breakout and retest
Keep SL below Retest zone (demand zone)
1:1 trade

HCL tech weekly cmp 1130Cup and handle on wekly.
Looks strong above 1150
Possible targets 1190-1210-1275-1360
SL 1080

hcl tech daily timeframehcl tech looking for breakout
daily cahrt of hcltech looking good
if sustain above 1133 target 1333 sl 1077

HCLTECH- BUY Signal- Low Volume- Strong Candle thoughAfter analyzing HCLTECH's stock, there are indications that a potential breakout may occur shortly. Several factors suggest that the stock's price could experience a significant movement.
However, it's important to note that stock market investments come with inherent risks, and accurately predicting breakouts or price movements is challenging. It's advisable to consult with a financial advisor or conduct further research to validate the analysis and make informed investment decisions.

HCLTECH -long most of IT stocks looks bullish
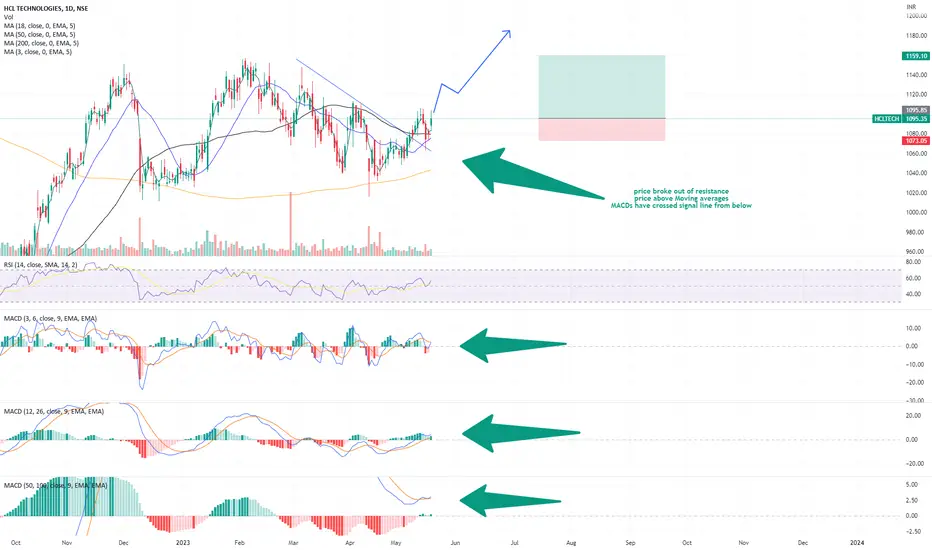
HCL TECH
price has broken out of resiatcne line
price above moving avearges (hourly and daily)
MACDs have crossed sugnal line from below

Swing Trade Entry Based on Resistance BreakoutTaken swing trade Based on breakout of resistance line,
Will look forward to take profit at around 6% based on the body of the trading range prior to the breakout.
Followup me trade ideas and updates on the ideas.

HCL this year moveLooks like HCL will take support near 822 for this year based fib level, and support and resistance

HCLTECH | About to take off from the cliffHCLTECH | About to take off from the cliff
CMP : 1100
SL : 1030
Target : 1300
1:3 risk reward setup

HCLTECH - #intraday Chart Analysis || 11th May,2023 #stocksAnalysis Criteria Used:
1. Please find the Chart Analysis done for the Intraday Trade Idea levels for 11th May, 2023
2. The analysis for the Trade ideas, has been done based on Trend analysis and Chart Patterns with Volume Buildups
Focus On:
1. Always keeping your Risk Management in play
2. Using a Stop Loss; because it is your Best Friend
3. Always Plan your Trade and stick to your Plan
4. Dont overthink or overanalyse
5. Treat this as your Business and get serious about it
#sharemarket #stockmarket #nifty #sensex #investing #trading #nse #bse #stockmarketindia #stocks #indianstockmarket #investment #stockmarketnews #banknifty #finance #money #intraday #intradaytrading #investor #niftyfifty #dalalstreet #sharemarketindia #sharemarketnews #stockmarketinvesting #business #sharemarkettips #stock #india #indiansharemarket #rakeshjhunjhunwala #bhfyp #mumbai #share #wealth #investment #market #invest #trading #investing #finance #FinancialFreedom #investor #trader #stocks #profit #investors #economy #equity #shares #nifty #stockexchange
DISCLAIMER:
.
* Please do your own research and/or contact your financial advisor before taking any trading opportunities
** We will not be responsible for your profit or loss
*** We are NOT SEBI REGISTERED
______________________
best stocks to buy today
best stocks to buy now
best stocks to buy
best stocks for Intraday tomorrow
best stocks for long term investment
best stocks to buy today india
best stocks for swing trading
swing trading strategies
swing trading beginners
what is swing trading
swing trading stocks
swing trading stock selection
swing trading kya hai
nifty analysis
nifty view
bank nifty analysis
top stocks to buy now
strong stocks
nifty view
nifty prediction
stock market view tomorrow
bank nifty Levels
bank nifty prediction
share news
stock market news
best stocks to buy now
profit booking stocks
multibagger stocks in discount
breakout stocks
best short term stocks
best short term shares
next multibagger stocks


#Hcltech cash : Looks good around 1070-1075#Hcltech cash -Positional call
10.05.2023
Looks good around 1070-1075
Stoploss 1040
Target 1112/1140++
Cmp 1080

HCLTECH- Bears in Control!Attached: HCLTECH Daily Price Chart Live Market as of 20th April 2023
Pay attention to the following:
1) Formation of a Double Top/ Distribution Pattern
2) A Leading Diagonal Structure marked as ABCDE , so a 3rd Wave Down can play out
3) The Elliot Wave marking signaling end of (B) Wave and (C) Wave Down pending
IT Sector is the Weakest already and there are clear Headwinds from a Fundamental standpoint for IT Stocks
HCL Technologies has Earnings today so you can expect some Big Move on the Short Side

HCLTech downtrend movement potential with RISK:REWARD 2.1 HCLTech downtrend movement potential with RISK:REWARD 2.1
Symbol :HCLTech
Time frame :1 hour
Analysis: Break out from the symmetrical Triangle and rallied downside, re-tested, and again rallying on a downside.So, We can expect a SELL call. SELL below 1070 with stop loss 1108 and target 990.
HOPE our analysis is adding value to your Trading Journey.
NOTE: Published Ideas are for ‘’EDUCATIONAL PURPOSE ONLY’’ trade at your own risk.
NOTE: RESPECT The risk. SL should not be more than 2% of the capital.
Happy Trading
#stockmarket, #sensex, #bse, #sharemarket, #nse
#stockmarketnews
#niftyfifty, #nifty ,#stockmarket, #sensex, #bse, #sharemarket, #nse ,#banknifty, #intraday ,#indianstockmarket ,#stockmarketindia ,#intradaytrading ,#investing, #trading, #stockmarketnews

intradayboth side potential
avoid first 15min breakout
wait for 15 min candle closing
targets are marked
follow risk management
do your own analysis
do workout
do meditation
start reading book

HCLTECH Downtrend movement potential with RISK:Reward 3.3#HCLTECH #stockmarketindia #HCLTECHanalysis #tradingstrategy
Symbol:HCL Tech
Time frame: 2 hours
what is the analysis?
Breakout from the symmetrical Triangle for downtrend movement.
Moving average condition is checked,RSI condition is checked, so the call is fulfilled for a downtrend/sell call with Risk:reward ratio of 3.3.
Stoploss is 27 points and the target 91 points.
sell at 1086 with SL 1115 and target 995.
HOPE our analysis is adding value to your Stock market trading Journey.
NOTE: Published Ideas are for ‘’EDUCATIONAL PURPOSE ONLY’’ trade at your own risk.
NOTE: RESPECT The risk. SL should not be more than 2% of the capital.
Happy Trading


LONG CALL ON HCL TECHNOLOGIESBreakout is seen on both daily charts as well as 15 min charts.
Targets 1112/1135
Stop loss 1185

HCL Tech a clear winnerHCL Tech is a leading tech company that has been making headlines recently due to its impressive performance in the stock market. With the stock recently taking support from a disjoint channel on the daily timeframe, investors are beginning to take notice of the potential for a long strategy on this promising stock. In addition to this technical support, HCL Tech also maintains a healthy dividend payout that is uniformly distributed across the year, making it an attractive investment option for those seeking long-term gains.
Furthermore, HCL Tech has also taken support from a previous level on the daily timeframe, indicating that there may be some underlying strength to the stock's current price movement. When combined with the company's strong fundamentals, such as its solid financial position and impressive track record of growth, it's clear that HCL Tech is one of the most promising tech companies in the market today.
Despite being relatively underrated compared to other tech giants like Infosys, TCS, and Wipro, HCL Tech is quickly gaining a reputation as a top performer in its industry. With its impressive fundamentals and recent technical support, now may be the perfect time for investors to consider a long strategy on HCL Tech stock. By taking a cautious and informed approach to investing in this promising company, investors can potentially reap significant rewards in the years to come.

Cup and Handle PatternA cup and handle price pattern on a security's price chart is a technical indicator that resembles a cup with a handle, where the cup is in the shape of a "u" and the handle has a slight downward drift.
The cup and handle is considered a bullish signal, with the right-hand side of the pattern typically experiencing lower trading volume.
Script = HCl Tech
Time Frame = 1 Day
