HCLTECH Analysis- Why not to enter based on support or fibo onlyHCLTECH Analysis- Why not to enter based on support or fibo only. Focus on price action as well with Fibonacci.
HCLTECH trade ideas

HCLTECH Rounding TopSell HCLTECH closing 1094.85 with 1130 then targets are 1065-1020.
Selling Reasong.
1 --> Create Double Top On TOP.
2 --> Rounding Top Form On TOP.
3 --> Break the Trendline.
4 --> Trendline is also Ready to break the 40.
5 --> ADX is show the Bearish move and -DMI is rise.
6 --> Volume is also show the Bearish Move.

Sell trade in HCLTECH as breakout failureShorting HCLTECH through put bear spread with SL of 1157 for target of 1085 at current level of 1128 logic is breakout failure.

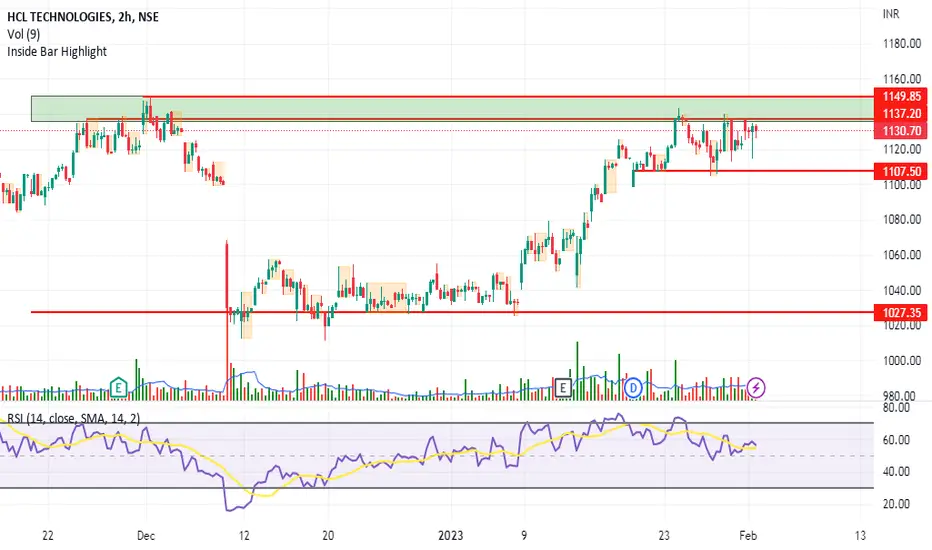
HCLTECH: Rounding TopFrom Jul'22 low of INR 877 prices have retraced to Fibonacci 61.8% retracment level positioned at 1150 zone and formed a potential double top structure. Prices have also formed a Rounding Top pattern whose neckline is in the region of 1101-1100. The measured target for the pattern is coming in the region of 1050-1045 where its 200-EMA is also positioned
As per above observations prices are likely to hold below INR 1137 and fall towards INR 1050-1045 in the coming weeks.
Trading Strategy: Sell on cmp add on rise , keeping SL of 1137 look for the target of 1050-1045.

Head and ShouldersA head and shoulders pattern is a technical indicator with a chart pattern of three peaks, where the outer two are close in height, and the middle is the highest.
A head and shoulders pattern—considered one of the most reliable trend reversal patterns—is a chart formation that predicts a bullish-to-bearish trend reversal.
An inverse head and shoulders pattern predicts a bearish-to-bullish trend.
The neckline rests at the support or resistance lines, depending on the pattern direction.
Script = HCL tech
Time Frame = 1 Day

HCLTech: Weak Candle formationNSE:HCLTECH , in Daily Timeframe, showing weakness because of:
It's near the demand zone
Created a proper bearish engulfing candle pattern
Weakness is RSI

RSI direction opposite to trend Looks bearish
if a strong bearish looking candle forms/passes through 1097.95- then likely to reach 1041.20 or 1024.15
Look for volumes/candle while entering.

Cup and Handle PatternA cup and handle price pattern on a security's price chart is a technical indicator that resembles a cup with a handle, where the cup is in the shape of a "u" and the handle has a slight downward drift.
The cup and handle is considered a bullish signal, with the right-hand side of the pattern typically experiencing lower trading volume.
Script = HCL Tech
Time Frame = 1 Day

Triangle PatternA triangle chart pattern involves price moving into a tighter and tighter range as time goes by and provides a visual display of a battle between bulls and bears.
Script = HCL Tech
Time Frame= 15 min

Triangle PatternA triangle chart pattern involves price moving into a tighter and tighter range as time goes by and provides a visual display of a battle between bulls and bears.
Script = HCL Tech
Time Frame= 15 min

Hcl Technologies - Ready for next hikeStock is on the resistance line. Have all chances to break the trend line with in 20-30 days. Can get an upmove up to 15%

HCL TECH --POSITIONALHCL TECH ---POSITIONAL-- DAILY CHART
1. HCL TECH seen trendline breakout on daily chart at todays daily candle
2. Stock seen double bottom formation at 880 sub level before breakout done today
3. trix line seen bullish crossover at current level .
4. one can BUY 935-945 for positional target 1000-1050-1100 ( 1 Month) Stop loss can be place bellow double bottom level 875
THIS IDEA IS FOR EDUCATIONAL PURPOSE
** trade at own risk .!
HAPPY TRADING. !!

HCLTECHIn the Weekly chart of HCLTECH,
we can see that after a 10% fall and 4 week of consolidation at 1020-1060 levels,
it has recovered and given a breakout of Cup & Handle Chart Pattern.
1200 is the new resistance

intradaybuy if it breaks the level with good candle and good risk reward ignore first 15min breakout
follow risk management

Hcl Technologies LimitedDaily Breakout
Weekly Breakout
Monthly Breakout
Strongly bullish stock.
Take position @ 1150-1155

HCL TechHCL Tech 2Hr time frame..
If HCL Tech brake level 1150 up side and sustain..
then it will go upward..
Target
1st 1160
2nd 1172
HCLTECH SWING TRADE ON BREAKOUTThis Is A Pure Technical Analysis Of hcltech
1)The Stock Has Taken An Amazing Support At Fibonacci Retracement Of 50% In Weekly And Daily Time Frame.
2) It Has Been Forming A Really Convincing Cup And Handle Pattern And Currently Trading Above Breakout Of The Pattern.
As We Can See In The 15 Minutes Time Frame Picture (please Check The Numbers Marked On The Picture):-
1) The Stock Has Been Consolidating Above Key Support Zone (acting As Support Zone From August 2021).
2) The Stock Is Forming A Triangle Pattern And This Pattern Has A Win Rate Of Over 70%(as Per Google Research). The Breakout Can Be A Triangle Pattern Breakout And A Range Breakout Hence 2 Confirmations That Bulls Are Strong.
3) The Stock Has Formed A Strong Green Candle(extremely Bullish Candle) And Has Closed In The Upper Part Of The Range Above A Key Level(marked On Chart With Yellow Zone)
4) Let The Stock Take A Hit From Sellers (marked Red Zone) And Then Retrace To Take A Support. We Will Enter At The Breakout Of Most Recent High.
ENTRY : 1144
SL : 1100
TARGET 1 : 1200
TARGET 2 : 1350+
Disclosure : I am not SEBI registered.The information provided here is for education purposes only.I will not be responsible for any of your profit/loss with this channel suggestions.Consult your financial advisor before taking any decisions.

Trend Identification: Utilizing Higher Highs and Higher LowsTechnical Indicator - William Fractal
Setting - 20 period
About the Indicator : William Fractal is a technical analysis tool used by traders in financial markets to identify potential turning points and trends. It is based on the concept of fractals, which are self-similar patterns that repeat themselves on different scales. The William Fractal is formed when there is a series of five bars, with the middle bar having the highest high and the lowest low in comparison to the surrounding bars. Traders use this pattern to determine potential buy and sell signals, as a fractal forming at the bottom of a downtrend could signal a potential reversal, while a fractal forming at the top of an uptrend could signal a potential trend continuation. The William Fractal can be used in combination with other technical indicators to improve trading decisions.
Benefits of using William fractal indicator
Easy to Identify : The William Fractal is a simple and straightforward pattern to spot, making it accessible for traders of all skill levels.
High Accuracy : The pattern is based on the concept of fractals, which have a high degree of accuracy in identifying trend reversals.
Confirms Trend Strength : By highlighting areas of potential trend reversal or continuation, the William Fractal can help traders confirm the strength of a trend.
Improves Timing : By using the William Fractal in conjunction with other technical indicators, traders can improve the timing of their trades and increase the chances of success.
Identifies Key Turning Points : The William Fractal can help traders identify key turning points in the market, allowing them to make informed trades and take advantage of market movements.
Works in All Markets : The William Fractal is applicable across different financial markets, including stocks, forex, and commodities, making it a versatile tool for traders
Try this out and let me know your thoughts in the comment section.


Double top pattern reversal in HCLTECHHCLTECH
Key highlights: 💡⚡
📊On 1D Time Frame Stock Showing Reversal of Double top Pattern .
📊 It can give movement upto the Reversal target of below 1025+.
📊 Can Go Short in this stock by placing stop loss above 1145or last swing high.

HCLTECH - Possible Swing TradeDaily chart: If we look at the daily time frame, we can see that the stock is trading above the 50 and 200 moving averages.
You may also notice that the stock is currently trading in a very strong zone since January 2021, which is about two years.
75-Minute Chart: if we look at the 75-minute chart, we can see that the stock has broken the rectangle &retested the breakout.
currently trading below the 200EMA and trading in the strong zone that we mentioned earlier.
If the zone and 200 EMA were broken with a bullish candle, we might consider planning a buy entry.
We can see a gap on the chart, so if a buy entry occurs, we can set our target price below the resistance area that is located exactly at the gap.
On the chart, I have noted targets 1 and 2, and a stop loss should be placed below the strong zone.
"Wave Volume Divergence" indicator has also given us a buy signal, must try this indicator for confirmation.
I hope this analysis was helpful to you. If so, I would appreciate it if you would like it and follow me on TradingView for more of these kinds of analysis.
Disclaimer : Simply an educational post, I am not a SEBI-registered person.

HCLTECH BREAKOUTHcltech given breakout from parrelel channel
trading above 20ema
immediate target can be 1120
educational idea only

HCL TECHHCL TECH
Its been trading in the big candle range
Results today, Hopefully we may see breakout or breakdown of this range and start getting trending moves. Keep an eye on this in coming days.
