Intraday setup on 29/04/22Read the chart and prepare ur own trade
Keep strict sl
Manage risk reward properly
Iam not responsible for any profit and loss
HCLTECH trade ideas

HCLTECH Long termbias is up in recent range might be in phase B
buy at lower parallel of pitchfork
1:3 RR minimum
sl below 800

HCL TECHNSE:HCLTECH is a dark horse from the IT sector
the previous day it has delivered a very good result.
and taking very good support from 1054 levels,
so, one can add this stock for short-term target of 1250 and long term target of 1660.

buy and accumulate HCL Hold at present levels
Positive Results
Chart Patterns suggest the begining of a triple bottom

HCL Tech Daily ChartHCL Tech is a good Pick can go long on hitting Daily Demand Zone of1105 Target 1243-1259 SL 1067

HCL TECH LOOKS WEAK BELOW 1115HCL Tech looks weak below 1115 for the lower marked targets on the chart.
To motivate us, Please like the idea If you agree with the analysis.
Happy Trading!
InvestPro India Team

HCLTECH - LongHCLTECH Buy at CMP and safe exit at target 1. You can trail your SL to lock your profit.


Stock is at Crucial Levels : HCL Tech
HCL Tech is above its long term trendline starting Nov 2020, which is been respected 6 times in the past(Trendline life - approx 18 months), price action starting Sep 21 was the HH of the sequence, followed by LH & LL...as of now, stock is at crucial level & might continue the bearish sequence starting Sep 21.....Plan 1 & 2 with levels are mentioned on the chart
Wish You Happy & safe trading
Views are for ‘’EDUCATIONAL PURPOSE ONLY’’ trade at your own risk.
"Always Respect Risk"
Happy Trading
Jai Hind Jai Bharat

#StockMarket #StockIdeas #StocktoWatch #StockToBuy #positionalHCL TECHNOLOGIES
On daily chart Stock trading in a Channel and now at bottom of channel
Keep on watchlist for any side moveand took trade for4-7%
Also keep on watch for Intraday, with 5min chart for Targets and SL; based on support/resistance
In case of Gap up or Gap down, avoid Intraday trade
----
Note:
Above levels are for education purposes only
Do your own analysis before taking any trade
Please Like & Follow


HCLHCL at support
Look for a good green closing for a valid entry
Technical analysis based on Trendlines & Price action
Use it just for reference and do your own analysis

HCL Tech flag and pole patternOn a daily time frame, the stock after a bull Run has been consolidating.
The flag and pole pattern is a bullish pattern and once it breaks out of the parallel channel it will give good targets.
Support :- 1150, 1138
Resistance:- 1223, 1254
Wait for the break out of the parallel channel

hcl tech buyBuy from cmp to 1168
easy tg - 1190
tg2 - 1204
Disclaimer : This is my personal analysis for study purpose not intended for trading

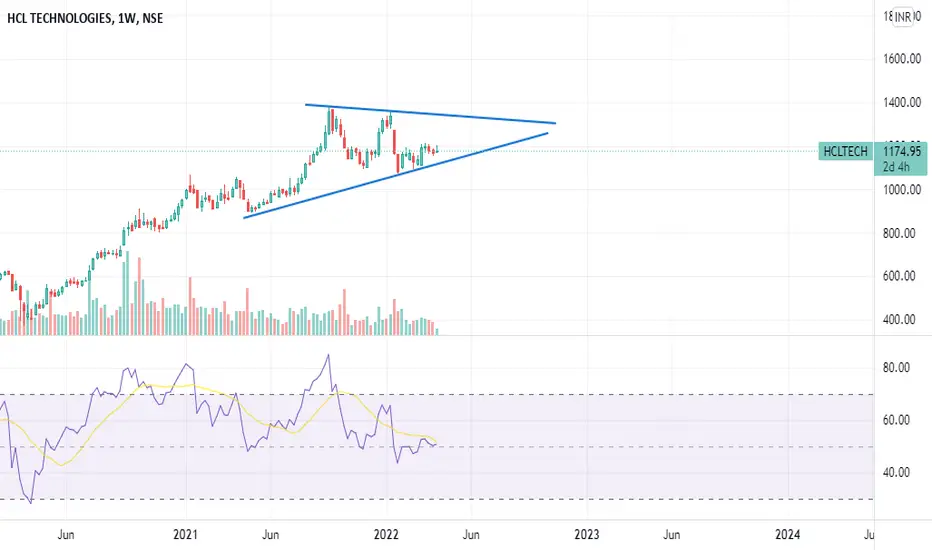
Weekly Triangle Breakout in HCL TECHNOLOGIESWait for Entry., Mostly it works perfectly with good risk reward
HCLTECH falling wedge pattern BO in hourly TFHCLTECH falling wedge pattern BO in hourly TF. Looking bullish in Daily TF also.


#HCLTECH Buy on Weekly Cl abv 1175 , Tgt 1214/ 1268#HCLTECH #SWINGTRADING #CNXIT
Buy on Weekly Cl abv 1175
Tgt 1214/ 1268
SL 1155
Risk : Reward 1:2 ( 1214) & 1:4 (1268)

HCL tech - buy on dipsBuy from 1145 to 1135
easy tg 1160
tg2 - 1190
Disclaimer : This is my personal analysis for study purpose not intended for trading

Intraday setup on 31 march3 hours ago
See the chart and prepare your own trade
Keep strict sl
Risk reward should be more than 1:2
Maximum trades 2-3 per day
Don’t take revenge trades
Disclaimer: iam not sebi registered I and iam not responsible for any profit and loss

hcl for short time buy signalhcl tech. for short time buy signal.
If you get sell signal comment bellow.

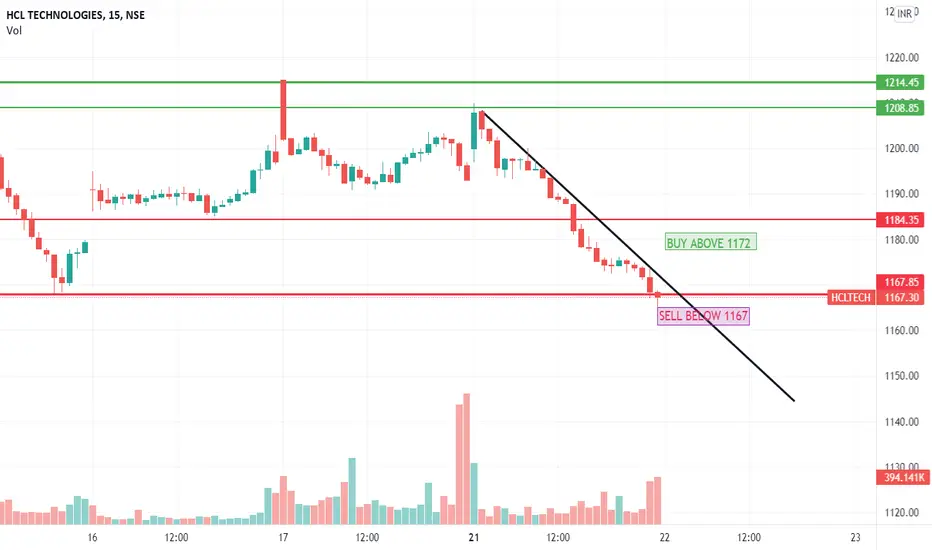
PRICE ACTION ANALYSISIts simple Price Action Based Analysis that if Tomorrow HCL Technology break the support till 1165 then it is good for short. And if it breaks trend resistance till 1172 then its good for long.