BuyHCL Technologies (HCLTECH)
Current Price: ₹1,210
Trend: Strong uptrend
Catalyst: HCLTech's shares surged 7% after the company projected better-than-expected revenue growth for fiscal year 2026, driven by strong earnings and optimism over easing U.S.-China trade tensions.
Dalal Street Journal
+9
Business News Today
+9
Stocks
Trade ideas

HCLTECH-INTRADAY-LONGStock is forming Ascending tringle in 1hr chart. Good opportunity to go long if it opens flat.
Ignore if it opens below 1405, if gap up wait for retest at 1426.
Please don't forget click on follow button so you won't miss any upcoming ideas.
Any confusion, feel free to drop msg. Happy to help :)
This is only for educational purpose, please manage your risk accordingly.

Short term strategy for hcltechthis stock price is moving northward after formed double bottom near at 1300. i think upward momentum remains in this stock before announcement its quartely earnings dates on 22/04/2025. we can buy this script around 1350 if it opened on monday at above mentioned price. the target price is 1650 for short term and keep maintain stop loss at 1250 on daily closing price basis.
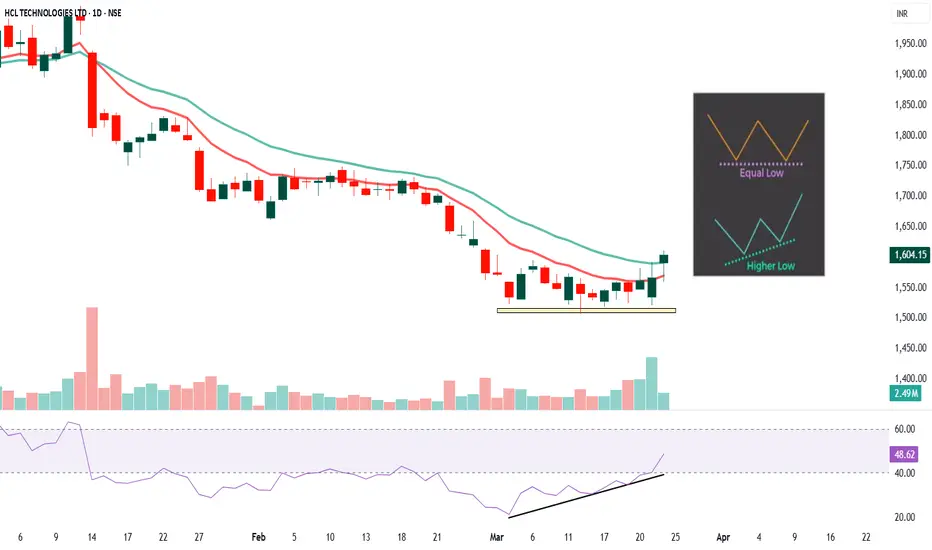
HCL Technologies Ltd (HCLTECH)
1. RSI Weak Divergence
The RSI (Relative Strength Index) is showing a higher low while the price has formed an equal low on the chart.
This is a sign of weak bullish divergence — the RSI is improving despite the price showing no significant upward movement.
Weak divergence often indicates that buying pressure is gradually increasing but is not yet strong enough for a full trend reversal.
RSI value is currently 48.62, which is in the neutral zone (between 40 and 60), suggesting moderate momentum.
2. Candle Pattern
A double bottom formation is visible on the chart (highlighted by the yellow zone).
The candles near the double bottom are forming higher lows, suggesting that sellers are losing strength.
Recent green candles with increasing volume confirm buyer interest at the support level.
3. EMA Analysis
10 EMA (red) < 20 EMA (green) ➔ Still bearish trend but flattening, indicating potential trend reversal.
Price has recently closed above the 10 EMA, showing an early signal of bullish momentum.
For a confirmed trend reversal, the price needs to sustain above both the 10 EMA and 20 EMA with increasing volume.
✅ Potential Strategy
📌 Entry:
Ideal entry after a confirmed close above the 20 EMA (~₹1,620–1,630).
Alternatively, wait for a pullback to the 10 EMA with a bullish confirmation candle.
🎯 Targets:
First target = ₹1,650 (recent swing high).
Second target = ₹1,700 (psychological resistance).
🚨 Stop Loss:
Place stop loss below the double bottom support (~₹1,540).
🔁 Exit:
Trail stop-loss using the 10 EMA once the price moves favorably.
Exit if the price closes below the 10 EMA with high volume.
⚠️ Educational Disclaimer
This analysis is for educational purposes only and does not constitute financial advice. Trading involves substantial risk, and past performance is not indicative of future results. Please conduct your own research and consult with a financial advisor before making any trading decisions.
BEARISH View On HCL **HCL Technologies** (officially **HCLTech**) is a leading Indian multinational information technology (IT) services and consulting company. It is part of the **HCL Group** and is known for its strong presence in **software development**, **IT infrastructure**, **engineering services**, and **digital transformation**. HCL is among the top five IT services companies in India by revenue and market capitalization.
---
## **Key Facts**
- **Founded:** 1976 (as Hindustan Computers Limited)
- **Founder:** Shiv Nadar
- **Headquarters:** Noida, Uttar Pradesh, India
- **Chairman:** Roshni Nadar Malhotra (first woman to lead a listed Indian IT company)
- **CEO:** C. Vijayakumar
- **Employees:** Over 225,000 globally
- **Revenue:** Over **$13 billion** (FY 2023)
- **Stock Listings:**
- NSE: HCLTECH
- BSE: 532281
---
## **Services and Offerings**
### 💻 **IT and Business Services**
- Application development and maintenance
- IT infrastructure management
- Cloud and hybrid cloud solutions
- Cybersecurity services
- Data and analytics
---
### ⚙️ **Engineering and R&D Services**
- Product development and innovation
- Embedded systems and IoT (Internet of Things)
- Automotive and aerospace solutions
- Healthcare and life sciences R&D
---
### 🌐 **Digital and Consulting Services**
- Digital transformation strategy
- AI and machine learning solutions
- Blockchain and automation
- Customer experience management
---
### 🏢 **Enterprise Solutions**
- SAP and Oracle solutions
- Supply chain and logistics management
- Customer relationship management (CRM)
---
## **Key Products and Platforms**
- **HCL DRYiCE** – AI and automation platform
- **HCL Volt MX** – Low-code app development platform
- **BigFix** – Endpoint management solution
- **HCL Software** – Acquired IBM's software products (like Notes, Domino, and AppScan)
---
## **Global Presence**
HCL operates in over **50 countries**, with major delivery centers in:
🌍 United States
🌍 Europe (UK, Germany, France)
🌍 Asia (India, China, Japan)
🌍 Australia
---
## **Achievements and Recognition**
✅ Among the **top 20 largest IT services companies** globally
✅ Ranked among **Fortune 500 India** companies
✅ Recognized for its **sustainability** and **employee-friendly** policies
✅ Strong focus on **diversity and inclusion**
---
## **Key Competitors**
- **Tata Consultancy Services (TCS)** – Market leader in India
- **Infosys** – Strong competitor in IT services and consulting
- **Wipro** – Competes in software and business services
- **Accenture** – Global consulting giant
---
HCL Technologies Ltd. (HCL Tech) Stock AnalysisGlobalTradeHub | HCL Technologies Ltd (HCLTECH) Stock Analysis
Fundamental Analysis:
HCL Technologies, a leading IT services firm, benefits from strong digital transformation demand, cloud services growth, and a solid order pipeline. Consistent revenue growth and high margins support stability. Key risks include global economic slowdowns and currency fluctuations.
Technical Analysis:
The stock is near resistance at ₹1,700. A breakout could push it toward ₹1,800. Strong support lies at ₹1,600, with further downside risk if breached. RSI around 60 indicates bullish momentum but not overbought yet.
Key Levels:
- Resistance: ₹1,700 / ₹1,800
- Support: ₹1,600 / ₹1,500
Conclusion:
HCL Tech remains a strong IT player with growth potential. A breakout above ₹1,700 could drive further upside, while support levels offer buying opportunities. 💻📈

HCL TECH down side NSE:HCLTECH
hcl tech trendline brekside
stoploss 1730
best entry yet the time
target your
Disclaimer: This analysis is for educational purposes only.
Please assess your own risk tolerance and conslut with a financial advisor before trading.

HCL Technologies Ltd. (HCL Tech) Stock Analysis### **HCL Technologies Ltd. (HCL Tech) Stock Analysis**
---
#### **Fundamental Analysis:**
- **Company Overview:**
HCL Technologies Ltd. is one of India's leading global IT services companies, offering a wide range of IT solutions and services, including software development, digital transformation, cloud computing, cybersecurity, IT infrastructure management, and enterprise solutions. The company serves various industries, including finance, healthcare, retail, and manufacturing, with a significant global presence, especially in North America and Europe.
- **Revenue & Profit Growth:**
- **Revenue Trends:** HCL Tech has shown strong and consistent growth in revenue, driven by robust demand for IT services and digital transformation solutions. For FY2025, HCL Tech reported a 12% year-on-year revenue growth, reflecting continued strong demand for cloud and digital services.
- **Profitability:** The company enjoys a high-margin business model, driven by its focus on premium IT services and digital transformation. HCL Tech has delivered strong profitability, with EBITDA margins in the 20-22% range. The company's net profit has grown steadily, benefiting from its diversified client base and strategic investments in next-generation technologies.
- **Valuation (as of Feb 2025):**
- **P/E Ratio:** 23.8 (in line with industry peers, reflecting steady growth expectations in the IT services sector)
- **Price-to-Book Ratio:** 5.0 (indicating strong investor confidence and premium valuation compared to book value)
- **Dividend Yield:** 2.3% (HCL Tech offers a good dividend yield, appealing to income investors)
- **Key Ratios:**
- **Return on Equity (ROE):** 25.5% (indicating efficient use of equity capital)
- **Return on Assets (ROA):** 15.8% (demonstrates effective use of company assets)
- **Debt-to-Equity Ratio:** 0.1 (HCL Tech has a very low debt-to-equity ratio, signaling a healthy balance sheet and low financial risk)
- **Outlook:**
HCL Tech is well-positioned to capitalize on the growing global demand for digital services, cloud computing, cybersecurity, and automation. With increasing investments in AI and automation technologies, HCL Tech is likely to continue seeing strong growth in the coming years. The company's strong balance sheet and healthy cash flow provide it with the financial flexibility to invest in new technologies and expand its service offerings.
---
#### **Technical Analysis:**
- **Current Price:** ₹1,080 (as of February 2025)
- **Chart Overview:**
HCL Tech’s stock has been in an upward trend over the past year, with a few consolidations. The stock has shown resilience in market corrections and has consistently found support near ₹1,000, indicating strong investor interest. It is currently trading near its all-time highs, with a breakout potential if positive earnings or announcements are made.
- **Support and Resistance Levels:**
- **Immediate Support:** ₹1,000 (a key psychological level and support zone for the stock)
- **Next Major Support:** ₹950 (providing a solid cushion in case of a deeper correction)
- **Immediate Resistance:** ₹1,110 (recent high, a breakout above this could trigger more upside)
- **Next Major Resistance:** ₹1,150 (a significant resistance level in the stock’s uptrend)
- **Moving Averages:**
- **50-Day Moving Average (50-DMA):** ₹1,065 (indicating a neutral to slightly bullish trend in the short term)
- **200-Day Moving Average (200-DMA):** ₹960 (strong support level, indicating a positive long-term trend)
- **Relative Strength Index (RSI):**
- RSI is at 65, which is slightly approaching the overbought zone. A pullback or consolidation may occur if the RSI goes above 70, suggesting a temporary correction before resuming the uptrend.
- **MACD:**
- The MACD is showing a bullish crossover, supporting the ongoing positive momentum. However, investors should monitor for any divergence if the price starts rising too quickly relative to the MACD.
---
#### **Key Metrics:**
- **Market Capitalization:** ₹2.87 trillion (approx.)
- **52-Week High:** ₹1,125
- **52-Week Low:** ₹840
---
#### **Risk Considerations:**
- **Currency Risk:** As HCL Tech derives a significant portion of its revenue from international markets (especially the US), any fluctuations in the INR/USD exchange rate can affect profitability.
- **Competition:** The IT services industry is highly competitive, with players like TCS, Infosys, and Wipro also vying for market share. Intense competition could pressure margins and pricing.
- **Geopolitical and Regulatory Risks:** Being a global player, HCL Tech is exposed to geopolitical tensions, regulatory changes, and trade policies, particularly in key markets like the US and Europe.
- **Client Concentration:** Although HCL Tech has a diversified client base, it still relies on key clients for a significant portion of its revenue. A loss of a major client could impact future earnings.
---
### **Conclusion:**
HCL Technologies Ltd. is a strong performer in the IT services sector, with a robust growth trajectory driven by the increasing demand for digital services, cloud computing, and cybersecurity solutions. The company’s solid financials, low debt, and strong return ratios indicate that it is well-positioned for continued growth. Technically, the stock has been in an uptrend, with immediate support at ₹1,000 and resistance at ₹1,110. A breakout above ₹1,110 could signal further upside, while a pullback could occur if the stock approaches overbought levels.
HCL Tech is well-positioned for long-term growth, especially as the demand for digital transformation accelerates globally. However, investors should be aware of potential risks such as currency fluctuations, competition, and geopolitical tensions that could affect its performance.
---
**Disclaimer:** This analysis is based on publicly available information, and I am not a SEBI-registered advisor. Please conduct your own research and consult a certified financial advisor before making any investment decisions. This is for informational purposes only and should not be considered as financial advice.

HCL Technologies Ltd view for Intraday 15th Jan #HCLTECH
HCL Technologies Ltd view for Intraday 15th Jan #HCLTECH
Resistance 1840 Watching above 1842 for upside movement...
Support area 1800 Below 1820 ignoring upside momentum for intraday
Watching below 1792 or downside movement...
Above 1820 ignoring downside move for intraday
Charts for Educational purposes only.
Please follow strict stop loss and risk reward if you follow the level.
Thanks,

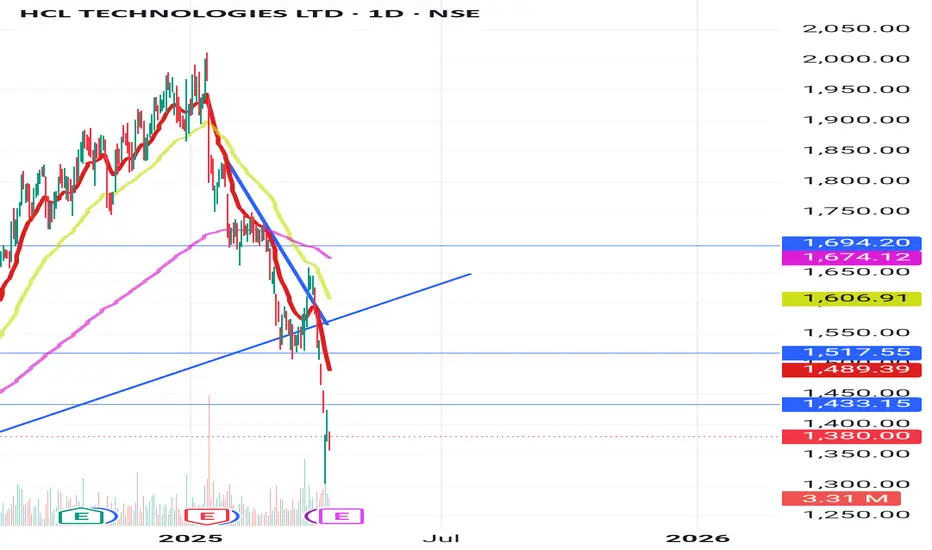
HCLTECH and the 1.618 Fib Extension reversalThe last time (2022), when the price broke out of the 1377 range, it exactly hit the 1.618% extension at 1697 and reversed to 1250-1350 levels.
This time also, it is showing reversal/topping out signs again at the 1.618% fib extension of the 1697 breakout. Also, the Rounding bottom pattern target is done on the upside.
Will it go down to 1600 levels this time? Wil the history repeat again?
I am not a SEBI registered Analyst. Views are personal and for educational purpose only. Please consult your Financial Advisor for any investment decisions. Please consider my views only to get a different perspective (FOR or AGAINST your views). Please don't trade FNO based on my views.

HCLTECH's Resilient Bull RunTopic Statement: HCLTECH is on a strong bull run, resilient to the recent market correction, with a healthy profit growth and price trading at its lifetime high within an up-trending channel.
Key Points:
1. Company reported a 7.5% profit growth QoQ.
2. Price is moving in an up-trending channel, simplifying channel trading.
3. Trading at its lifetime high.

HCL Technologies Ltd view for Intraday 13th Jan #HCLTECH
HCL Technologies Ltd view for Intraday 13th Jan #HCLTECH
Resistance 2000 Watching above 2006 for upside movement...
Support area 1960 Below 1960 ignoring upside momentum for intraday
Watching below 1957 or downside movement...
Above 2000 ignoring downside move for intraday
Charts for Educational purposes only.
Please follow strict stop loss and risk reward if you follow the level.
Thanks,

HCLTECH on a Bullish Run!
HCLTECH on a Bullish Run!
The stock has broken its key resistance level of *1990 and is now targeting
higher levels. The breakout is supported by increased volume, signalling strong buyer interest.
Key Levels to Watch: (Short Term)
Resistance: 2050|2075
Support: 1950/1900
Trend Insight: The bullish trend is intact with higher highs and higher lows. Keep this stock on your radar for potential upside opportunities!
#HCLTECH

HCL Tech: Channel Breakout Above 2000Details:
Asset: HCL Technologies (HCLTECH)
Breakout Level: Sustaining above 2000
Potential Target: To be determined based on breakout momentum
Stop Loss: Below 2000 or as per risk tolerance
Timeframe: Medium-term
Rationale: HCL Tech is holding strong above 2000, signaling the possibility of a channel breakout. Sustained buying above this level could trigger a significant upward move.
Market Analysis:
Technical Setup: The stock is poised for a breakout with sustained levels above 2000, supported by consistent volume and positive price action.
Sector Outlook: As a leading IT company, HCL Tech benefits from strong global demand for digital services and software solutions.
Risk Management:
Implement a stop loss slightly below 2000 to minimize downside risk in case of reversal.
Timeframe:
Medium-term move anticipated, contingent on sustained momentum and market conditions.
Risk-Reward Ratio:
Favorable setup with a strong breakout level and potential for significant upside.
Keep an eye on market sentiment and sector performance for additional confirmation.

A BUY setupAlways use proper risk management by assessing your financial goals and personal risk tolerance, ensuring you never risk more than you can afford to lose. Set a proper stop loss before entering any trade to minimize potential losses if the market moves against you, and stick to it without letting emotions interfere. Take full responsibility for your trading decisions, learning from mistakes to improve over time. Plan every trade carefully with clear entry, exit, and risk management strategies, as consistency and discipline are key to long-term success.


HCLTECH: Bullish Momentum Awaits Quarterly Results Topic Statement: HCLTECH is on a bull run, moving in an up-trending channel, but overbought conditions may lead to a correction pending upcoming quarterly results.
Key Points:
1. The stock is rising within an up-trending channel, indicating strong bullish momentum.
2. The price is overextended above the 180-day moving average, signaling overbought conditions.
3. The sustainability of the bullish trend depends on the outcome of the upcoming quarterly results.

HCL Deep Crab SL day candle close only, Target Trigger Price
All detail for chat. good entry at mark price only. and must stoploss minimum risk and good profit. risk ratio 1:1 to manage modified SL. This is not call, Just my idea. Please understand your risk and take full responsibility of your actions

HCL TECH - Bullish Outlook | Min 25%+ upside potentialPrice Analysis & Overview:
1. Breakout & Retest of the previous ATH levels.
2. Tapped Weekly demand area.
3. EMA support taken.
4. Showing good strength in buying.
5. RRR is favourable.
Trade Plan:
ENTRY = CMP 1440
SL= 10% 1300
TP = 1:2,1:3,1:4
- Stay tuned for further insights, updates and trade safely!
- These are my personal views.
- If you liked the analysis, don't forget to leave a comment and boost the post. Happy trading!
Disclaimer: This is NOT a buy/sell recommendation. This post is meant for learning purposes only. Please, do your due diligence before investing.
Thanks & Regards,
Anubrata Ray

HOW LIQUIDITY WORKS!In trading, liquidity refers to how quickly and easily an asset can be bought or sold in the market without significantly affecting its price. It reflects the availability of buyers and sellers and the volume of trading activity for a particular asset.
Key Aspects of Liquidity:
1. High Liquidity:
The asset can be traded easily with minimal price changes.
Common in popular markets like major stocks (e.g., Apple, Tesla), forex pairs (e.g., EUR/USD), and widely traded cryptocurrencies (e.g., Bitcoin).
2. Low Liquidity:
It’s harder to find buyers or sellers, leading to potential delays or price changes during transactions.
Common in niche markets, lesser-known stocks, or illiquid crypto tokens
Importance in Trading:
Efficient Price Discovery: High liquidity ensures prices reflect market demand and supply.
Lower Risk: Traders face less risk of slippage (unintended price changes during execution) in liquid markets.
Flexibility: Allows traders to enter or exit positions quickly, especially important for day traders and scalpers.
In summary, liquidity is crucial for smooth and cost-effective trading.
#Stockmarketeducation

VIEW ON HCLTECHGood chart structure
Stock at all time high
Yesterday all IT stocks were in good move
Target 1980/2010
Stop loss 1888
I am just representing my views
For educational purpose only.

9% in next 2-3 months HCLTECHThis chart illustrates a technical analysis of HCL Technologies Ltd. using a daily Heikin Ashi candlestick pattern. The price appears to be forming a 'cup and handle' pattern, which is considered bullish. The breakout above the resistance level of approximately ₹1,900 indicates the potential for an upward price movement. Based on this analysis, a target of 9% is anticipated over the next 2–3 months, aligning with the pattern's projected trajectory. The chart also features 30-day and 120-day SMA lines, reinforcing the bullish trend.

HCL tech Head And Shoulder Pattern. HCL tech Head And Shoulder Pattern.
Buy Above 1900 for Target of 2005-2010
Below Stop Loss 1815
