HDFCLIFE, 15min Falling Wedge BOFalling wedge BO in 15 min TF
Entry : 625
Target : 631/637
SL : 619
RR : 1 /. 2
HDFCLIFE trade ideas

📈 Exciting Bullish Pattern Alert! 🐂📈 Exciting Bullish Pattern Alert! 🐂
📊 Pattern: Symmetric Triangle
📌 Symbol/Asset: HDFCLIFE
🔍 Description: Stock is in a consolidation and making Symmetric triangle. We might see hige upside after breakout
👉 Disclosure: We are not SEBI registered analysts, this is not a buy or sell recommendation. Technical patterns are just one piece of the puzzle. Consider conducting further research, consulting with a financial advisor, and managing your risks appropriately.

HDFC LIFEHDFC LIFE is either moving in WXY or 12345.....both possibilities are shown on the chart.... For Educational purpose only.

HDFC LIFE RETESTING CRUCIAL RESISTANCEThe stock has given breakout from long range of patterns majorly inverse head and shoulder and has consolidated after giving breakout which is a good sign

HDFClifeparallel channel in progress. however this is overbought. retracement towards 600 would be good for fresh entry. Moving forwards as well it may remain slow of a year may be

HDFC LIfe Insurance Short Term Long Trade IdeaHDFC LIfe Insurance Short Term Long Trade Idea
Buying levels: Best Buying/Accumulation Zone between 644 to 655
Stop loss below 639
1st Target 677 t0 685
2nd Target 700 Plus
Disclaimer:
I do not give any tips or buy sell recommendation I only teach trading strategies.
These levels are purely based on Price action/demand and supply zones & and consumed only for educational purpose & should not be taken as buy/sell recommendation. I will not be responsible for any loss/profit incurred if anyone takes trades based on my view.
Please consult your Financial Advisor before making any trading decision

HDFC Life Important Levels.Some very important levels for HDFC Life.
Conclusion:
1. Go Long only above 652. Whole candle for a day should be above this. Immediate target of 684.
2. Watch out for levels around 600-620, a very favorable accumulation zone.
Possible Trades:
1. Sell 600 or 620 PE, Likely will be out of money.
2. Buy 680 CE once price reaches above 652.
3. Long future around 610 or 620, if it comes.

HDFC Life | 25 Sep | Trade JournalDisclaimer: Not any advice, I am here to learn and track my trades by maintaining a journal. Viewers’ knowledge and opinions are more than welcome as it helps me to learn.


HDFCLIFEIt is proving the fundamentals of technical analysis right.
That the resistance become support when it breaks the resistance and it has tested it also.
so hdfc life looking good for mid term investment of about 4 to 8 months for a good return.
buy at cmp
stoploss -candle closing below support levels on weekly tf
target- ATH+ approx 770 or 800+

HDFCLife ChartHere, is the chart of HDFCLIFE, Hope the levels will help you a lot to trade or invest...

HDFC Life form Inverse Head and Shoulder Pattern in hour chartI m not a SEBI registered analyst. This is only for educational purpose
HDFC Life form Inverse Head and Shoulder Pattern in hour chart.
Entry -> Can enter after Reversal candle formed in Right shoulder of 630 and above
SL - 624
Target - 650

HDFC Life - Keep on RadarThe stock has come down to the support area as shown on the charts. May reverse from here itself or may come down to even 600 levels. Keep tracking for a comfortable entry so that your stop-loss should be humble.
We should learn to hunt like a tiger. Show extreme patience. Take time to identify the trade to make a perfect entry. So that our target may not miss.
Only for learning and sharing purposes, not a piece of trading advice in any form.
All the best for your trading journeys.

HDFCLIFE Formed rounded bottom. Gave powerfull breakout of Multiple InsideBar. Looks good for short term invest/ swing trade.Trading at 657.keep sl 642.target 676/699/721/742. Only for education purpose.

HDFC LIFE READY TO BREACH LIFETIME HIGHSPATTERN- another day of cup and handle hunting and hdfc life is showing some promising pattern formation it has been in long consolidation and has dilligently followed a range and now is the time to yield the return of patience . it is a classic example of complex cup with handle pattern
TARGET - the stock can reach towards 880 levels in no time

Can $NSE:HDFCLIFE will Test 580 Level ?Dear Followers,
I hope you're doing well. I wanted to share a brief update regarding the short-term trend of the stock NSE:HDFCLIFE I have been monitoring.
Currently, the stock is experiencing a downtrend in its short-term price movement. My analysis indicates that market conditions and recent price action suggest a period of declining prices. This information could potentially be useful for your investment / hedge strategy.
If Stock Break 622-618 level then possibly we can see 600,590,580 level so if you are ready to take Risk then I have 2 Strategies For Month Of September Series that we can Deploy.
1) Buying an Option
Buy NSE:HDFCLIFE 620 PE Near 9, Stop Loss 5, target 15,17,20
Time Frame 7-8 Days
Investment =10000, maximum Loss=4400, Profit Upto 12100
2) Hedge strategy
Buy NSE:HDFCLIFE 630 CE Near 15-16 and Sell BSE:HDLF2! Future Below 625, Sl 640, Target 610,600,595
Investment = 40000
Maximum Loss = 12000
Profit Upto = 25000
Best regards,
Ajay Metha


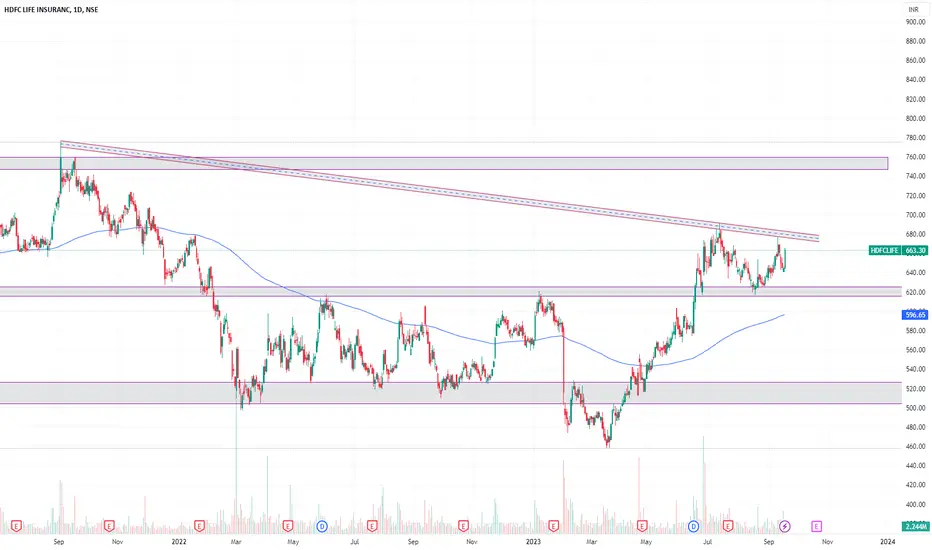
HDFC Life Insurance - An interesting CaseHere I am presenting an intriguing case involving HDFC Life Insurance stock⚡
On the left-hand side 👈 we have the weekly chart where two distinct zones emerged: a support zone and a resistance zone. An attempt to breach the support zone, occurring around 500, was made; however, this endeavor ultimately lacked follow through 😐 This resulted in a sudden and pronounced upward surge that propelled the stock past the resistance zone, situated around 617 🦾
On the right-hand side 👉 we have the daily chart. You can observe that the breakout of the resistance was not only successful but also promptly retested within a few trading sessions, leading to a resumption of the upward movement 🥂 Nonetheless, the stock encountered difficulties while approaching the 700 zone, culminating in the formation of a rising wedge pattern. It's worth noting that such a pattern is deemed bearish within the context of technical analysis ⚔
Subsequently, the stock experienced a retracement and has since retraced back to approximately the breakout level of 617. This specific level has previously acted as a point of resistance, thereby suggesting a likelihood of role reversal (may act as a support this time). Moreover, a closer examination of the candlestick patterns reveals that they have become narrower in proximity to the support area, indicating a potential waning of selling pressure👍
Furthermore, a falling wedge pattern, characterized as bullish, has also manifested. Should the stock's price successfully breach this wedge pattern to the upside, it may pave the way for an upward movement towards levels around 660, 700, or even 750 🚩
It's important to consider that this perspective would lose its validity should the price fails to escape the confines of the falling wedge pattern or commence trading below 600.
Thank you 🙏 for taking the time to read this analysis. If you find it insightful, please express your support 🚀 and anticipate more such ideas in the future 💰
Disclaimer: This is not an investment or trading advice. Please apply your own due diligence before investing your hard-earned money.

HDFCLIFE - potential upside of 15%Stock has taken support 2 times at level 620. This was the same level which acts as CHoCH for the stock in previous breakout. It may be a CWH pattern without clear handle and neckline getting retested.
Stock has posted highest ever results. It may reach the previous high which is 15% gain from current price.

#HDFCLIFE Pending a move down ?Stock ready to slip into supply zone with a break down of the triangle pattern .
Plot on chart for reference ~

HDFCLife....simple Support and resistance analysis on 1hrNSE:HDFCLIFE gave a breakout for the resistance of 645, with a good green candle in one hour time frame.
Entry - 645
Stoploss - 640
Target - 660
R:R - 1:3

