Hindustan Copper - LongHindustan Copper has recently shown strength by breaking above the 280 resistance zone with heavy volumes. This breakout is important as the stock was consolidating below this level for a long period, and now that resistance has turned into support. The overall trend since April has been upward, wit
5.05 INR
4.65 B INR
20.61 B INR
327.27 M
About Hindustan Copper Ltd
Sector
Industry
CEO
Sanjiv Kumar Singh
Website
Headquarters
Kolkata
Founded
1967
ISIN
INE531E01026
FIGI
BBG000DFQN20
Hindustan Copper Ltd. engages in the exploration, exploitation, and mining of copper and copper ore. Its products include cast copper rod, copper cathode, copper concentrate, copper sulphate, sulphuric acid, reverts, anode slime, and nickel cathode. The company was founded on November 9, 1967 and is headquartered in Kolkata, India.
Related stocks

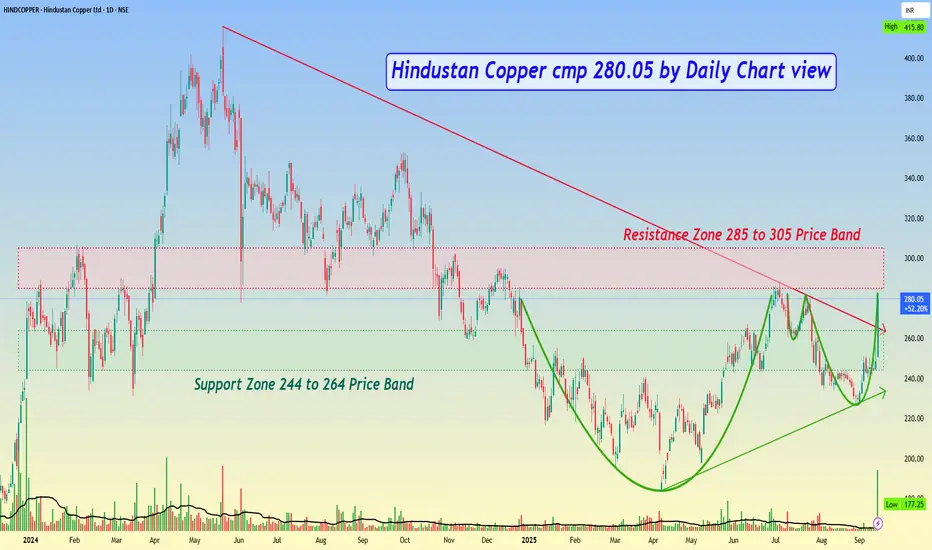
Hindustan Copper cmp 280.05 by Daily Chart viewHindustan Copper cmp 280.05 by Daily Chart view
- Support Zone 244 to 264 Price Band
- Resistance Zone 285 to 305 Price Band
- Huge Volumes surge by demand based buying
- Falling Resistance Trendline Breakout sustained closure
- Support Zone got well tested and retested over past few days
- Bullis
Hindustan Copper – Breakout or Double Top?After completing an impulse up to 287.65 (Wave 1) and correcting down to 226.70 (Wave 2), Hindustan Copper is now powering higher in what looks like Wave (iii) of 3.
Wave count : Wave 2 bottomed at 226.70, setting the stage for Wave 3.
Current move : Sub-waves (i) and (ii) are done, and price i

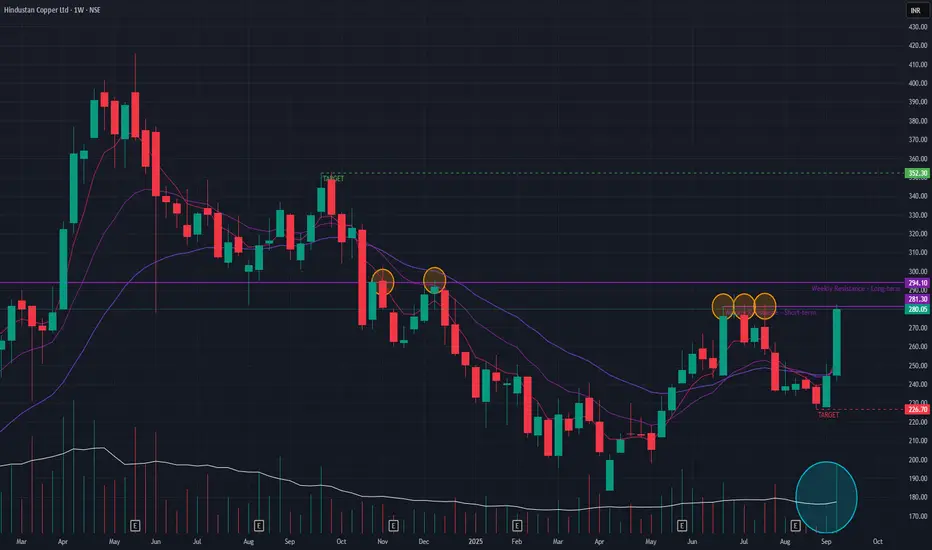
Hind Copper (Weekly Timeframe) - Potential BreakOut Candidate ??After a multi-year uptrend concluding in May 2024, Hindustan Copper entered a corrective downtrend. However, a potential reversal has been forming since April 2025, evidenced by a pattern of higher lows and a constructive setup in its short-term Exponential Moving Averages (EMAs).
This shift in sen
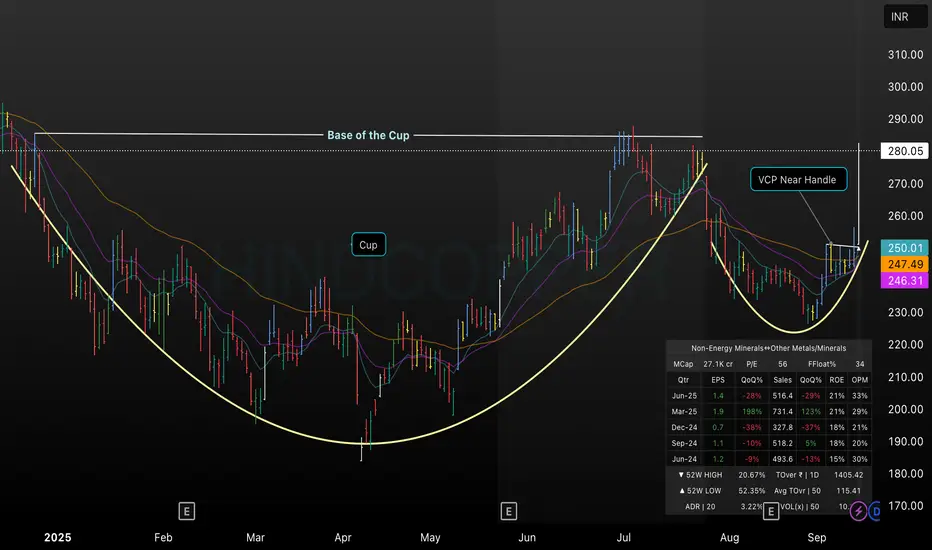
HINDCOPPER Cup & Handle Breakout: VCP Formation AnalysisThis chart showcases a classic Cup and Handle pattern on HINDCOPPER, with a clear base at 280. The handle displays a developing VCP (Volatility Contraction Pattern), signaling potential for an upside breakout. Key moving averages support the structure, and momentum appears strong following a 12.66%
A buying opportunityHindcopper CMP 241
Elliott - I had noticed the 5 waves in the rally from the lows. Hence this correction becomes an opportunity to buy. This rally will be the 3rd wave and hence will be a strong one. The Fib ext will guide u to the probable tgts.
Fibs - the stock is now taking higher fib zones

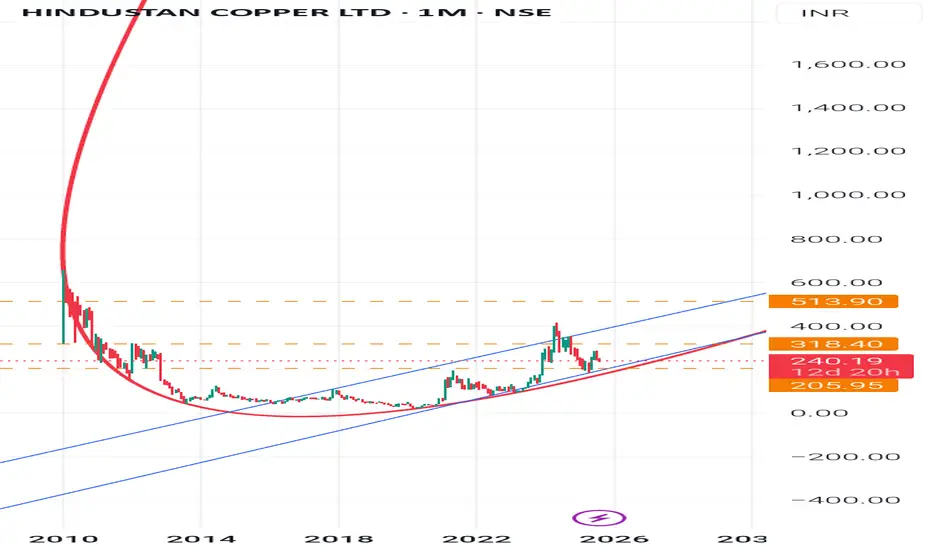
Hindustan copper Trend AnalysisHindustan Copper (HINDCOPPER) - Monthly Chart : Trend Analysis-
Long-term Trend: Strong uptrend since 2020, visible with higher highs and higher lows.
Current Position: After a sharp rally to 414, the stock corrected and is now consolidating around 280.
200-Month MA (red curve): Acts as a strong
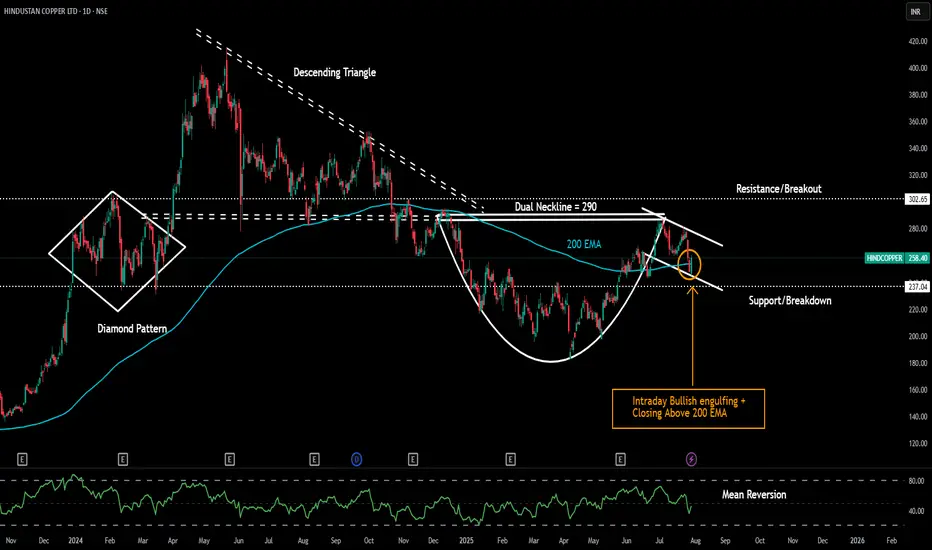
Hindustan Copper LtdDate 29.07.2025
Hindustan Copper Ltd
Timeframe : Day Chart
Technical Remarks :
1 Formed bullish engulfing on intraday closing basis
2 Closed above 200 exponential moving average
3 Took support from handle's bottom base
4 Dual neckline at 290 of descending triangle + cup & handle pattern
5
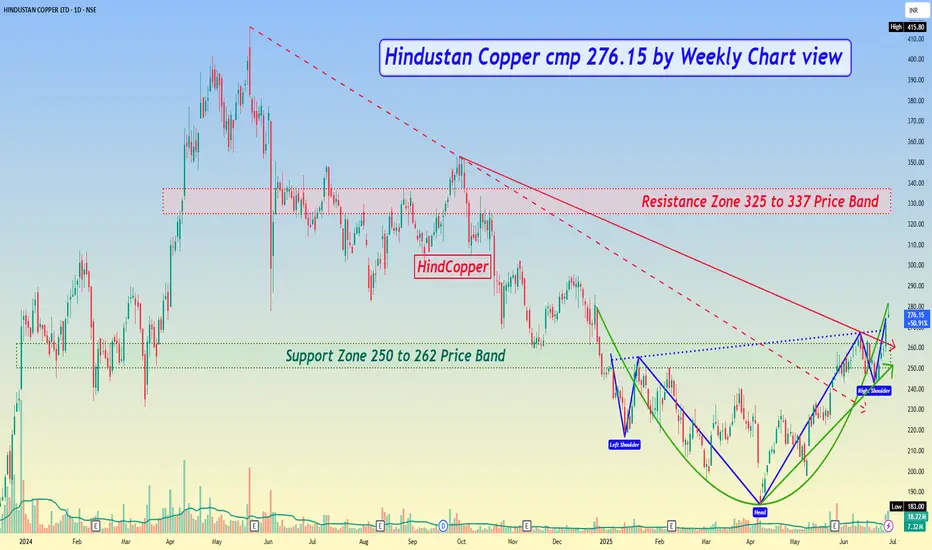
Hindustan Copper cmp 276.15 by Weekly Chart view*Hindustan Copper cmp 276.15 by Weekly Chart view*
- Support Zone 250 to 262 Price Band
- Resistance Zone 325 to 337 Price Band
- All major Technical indicators BB, EMA, MACD, RSI trending positively
- Stock is seen trending with positive momentum on Daily and Weekly Charts
- Rising Support Tren
HINDCOPPER | Supply-Demand Flip & Structure This chart shows a clean structural shift on the weekly timeframe for Hindustan Copper Ltd (NSE: HINDCOPPER):
🔷 Blue Zone: A key Supply-to-Demand Flip area. Price reacted strongly from this zone after multiple touches, showing its relevance.
📉 CT Line (Compression Trendline): Price was getting com

See all ideas
Summarizing what the indicators are suggesting.
Oscillators
Neutral
SellBuy
Strong sellStrong buy
Strong sellSellNeutralBuyStrong buy
Oscillators
Neutral
SellBuy
Strong sellStrong buy
Strong sellSellNeutralBuyStrong buy
Summary
Neutral
SellBuy
Strong sellStrong buy
Strong sellSellNeutralBuyStrong buy
Summary
Neutral
SellBuy
Strong sellStrong buy
Strong sellSellNeutralBuyStrong buy
Summary
Neutral
SellBuy
Strong sellStrong buy
Strong sellSellNeutralBuyStrong buy
Moving Averages
Neutral
SellBuy
Strong sellStrong buy
Strong sellSellNeutralBuyStrong buy
Moving Averages
Neutral
SellBuy
Strong sellStrong buy
Strong sellSellNeutralBuyStrong buy
Displays a symbol's price movements over previous years to identify recurring trends.
Frequently Asked Questions
The current price of HINDCOPPER is 307.45 INR — it has increased by 3.75% in the past 24 hours. Watch Hindustan Copper Ltd stock price performance more closely on the chart.
Depending on the exchange, the stock ticker may vary. For instance, on BSE exchange Hindustan Copper Ltd stocks are traded under the ticker HINDCOPPER.
HINDCOPPER stock has risen by 9.78% compared to the previous week, the month change is a 28.43% rise, over the last year Hindustan Copper Ltd has showed a −6.85% decrease.
HINDCOPPER reached its all-time high on Jan 20, 2010 with the price of 656.95 INR, and its all-time low was 18.30 INR and was reached on Mar 25, 2020. View more price dynamics on HINDCOPPER chart.
See other stocks reaching their highest and lowest prices.
See other stocks reaching their highest and lowest prices.
HINDCOPPER stock is 6.37% volatile and has beta coefficient of 2.13. Track Hindustan Copper Ltd stock price on the chart and check out the list of the most volatile stocks — is Hindustan Copper Ltd there?
Today Hindustan Copper Ltd has the market capitalization of 286.58 B, it has increased by 14.48% over the last week.
Yes, you can track Hindustan Copper Ltd financials in yearly and quarterly reports right on TradingView.
HINDCOPPER net income for the last quarter is 1.34 B INR, while the quarter before that showed 1.87 B INR of net income which accounts for −28.28% change. Track more Hindustan Copper Ltd financial stats to get the full picture.
Yes, HINDCOPPER dividends are paid annually. The last dividend per share was 1.46 INR. As of today, Dividend Yield (TTM)% is 0.31%. Tracking Hindustan Copper Ltd dividends might help you take more informed decisions.
Hindustan Copper Ltd dividend yield was 0.66% in 2024, and payout ratio reached 30.35%. The year before the numbers were 0.33% and 30.13% correspondingly. See high-dividend stocks and find more opportunities for your portfolio.
As of Sep 23, 2025, the company has 1.27 K employees. See our rating of the largest employees — is Hindustan Copper Ltd on this list?
EBITDA measures a company's operating performance, its growth signifies an improvement in the efficiency of a company. Hindustan Copper Ltd EBITDA is 7.38 B INR, and current EBITDA margin is 37.20%. See more stats in Hindustan Copper Ltd financial statements.
Like other stocks, HINDCOPPER shares are traded on stock exchanges, e.g. Nasdaq, Nyse, Euronext, and the easiest way to buy them is through an online stock broker. To do this, you need to open an account and follow a broker's procedures, then start trading. You can trade Hindustan Copper Ltd stock right from TradingView charts — choose your broker and connect to your account.
Investing in stocks requires a comprehensive research: you should carefully study all the available data, e.g. company's financials, related news, and its technical analysis. So Hindustan Copper Ltd technincal analysis shows the strong buy rating today, and its 1 week rating is strong buy. Since market conditions are prone to changes, it's worth looking a bit further into the future — according to the 1 month rating Hindustan Copper Ltd stock shows the buy signal. See more of Hindustan Copper Ltd technicals for a more comprehensive analysis.
If you're still not sure, try looking for inspiration in our curated watchlists.
If you're still not sure, try looking for inspiration in our curated watchlists.