5000 Days vs 500 Days of Data : Which is better ?Most traders jump straight into attractive chart patterns and impulsively take trades, ignoring the bigger picture. Here’s a powerful case study
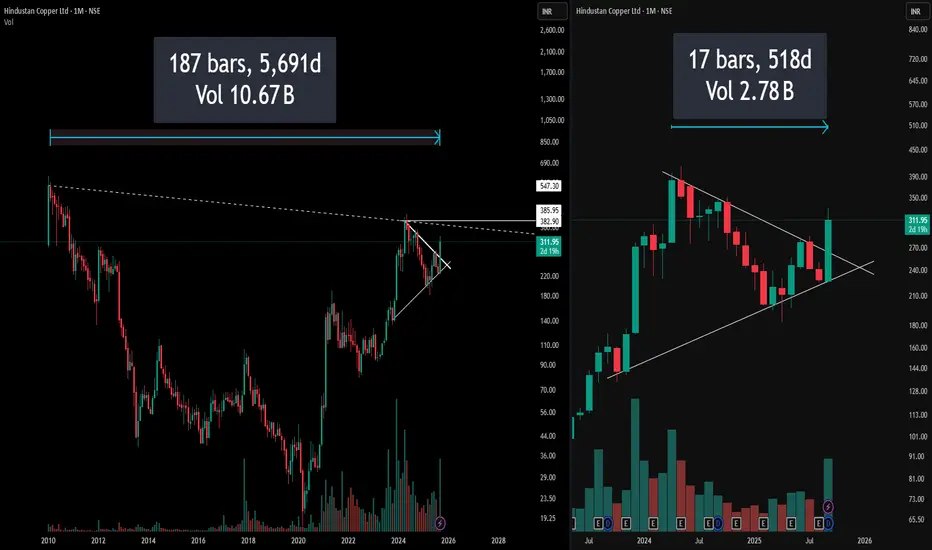
Left Side: Full Monthly Chart with Hidden Resistance
On the left, the chart captures over a decade of price action, immediately drawing attention to a long-standing downward-sloping resistance stretching from all-time highs. This hidden resistance line is not visible on the usual zoomed-in view, yet it presents a formidable barrier that traders often neglect.
(Pro Insight: Always extend trendlines and resistance zones till the inception of the instrument for real swing perspective)
(Risk Reminder: What looks like a clear breakout on a recent timeframe may actually be approaching a multi-year resistance trap)
Right Side: Symmetrical Triangle – The Pattern Focus
The right segment restricts focus to the last few years, zooming in on a visually perfect symmetrical triangle. While the setup looks neat and promising—indicating contraction and likely expansion ahead—this trimmed view risks obscuring the bigger, hidden resistance directly overhead.
Disclaimer: This post reflects technical views for educational purposes only, not investment advice. Always perform your own due diligence before trading.
HINDCOPPER trade ideas
Master Inside Bar Strategy with this Twist ( Wtf edition )Learn how to create a simple strategy and simply backtest it on Trading view .

HINDCOPPER H&S BREAKOUTHindcopper breaking H&S pattern weekly
huge volume this week with bullish rsi above 60
target1 375 target2 416
trading above all key ema
NO BUY/SELL RECOMENDATION

Hindustan Copper – Breakout or Double Top?After completing an impulse up to 287.65 (Wave 1) and correcting down to 226.70 (Wave 2), Hindustan Copper is now powering higher in what looks like Wave (iii) of 3.
Wave count : Wave 2 bottomed at 226.70, setting the stage for Wave 3.
Current move : Sub-waves (i) and (ii) are done, and price is pressing into resistance at 287.
Breakout zone : A decisive move above 287 could confirm the Wave 3 extension. Failure here risks a pause or even a double top.
Retracement supports : 272.75 (0.236) and 263.95 (0.382) are likely pullback zones if Wave (iv) comes into play.
Momentum check : Volume has spiked aggressively, adding weight to the bullish case, while RSI is overbought — suggesting short-term cooling is natural.
Summary : 287 is the key make-or-break zone. Break it cleanly, and Wave 3 marches forward. Fail, and we may see a corrective detour first.
Disclaimer: This analysis is for educational purposes only and does not constitute investment advice. Please do your own research (DYOR) before making any trading decisions.

Hindustan Copper - LongHindustan Copper has recently shown strength by breaking above the 280 resistance zone with heavy volumes. This breakout is important as the stock was consolidating below this level for a long period, and now that resistance has turned into support. The overall trend since April has been upward, with price forming higher highs and higher lows, which is a classic sign of an uptrend.
From a volume perspective, the breakout candle is backed by one of the highest volumes in recent months. This suggests strong participation from big players and institutions, making the move more reliable compared to a low-volume breakout. Sustained high volumes on up-days further confirm demand at higher levels.
The price pattern also supports bullish sentiment. After a long consolidation phase between 240–280, the price has given a clean breakout, indicating that accumulation may have taken place and buyers are now in control. Such range breakouts often lead to extended rallies if supported by market sentiment.
Support is now placed at 280, with deeper support around 245. As long as the stock trades above these levels, the structure remains positive. On the upside, 330 is the first resistance and 360 is a major resistance zone to watch.
Trade plan: A buy-on-dips approach near 285–295 with a stop loss at 270 can be considered. Targets may be set at 330 and 360. If the stock fails to hold 270, it would signal weakness and the trade should be exited.
Disclaimer: This analysis is for educational purposes only and not a recommendation to buy or sell. Trading and investing in the stock market involve risks. Please do your own research or consult a financial advisor before making any trading decisions.

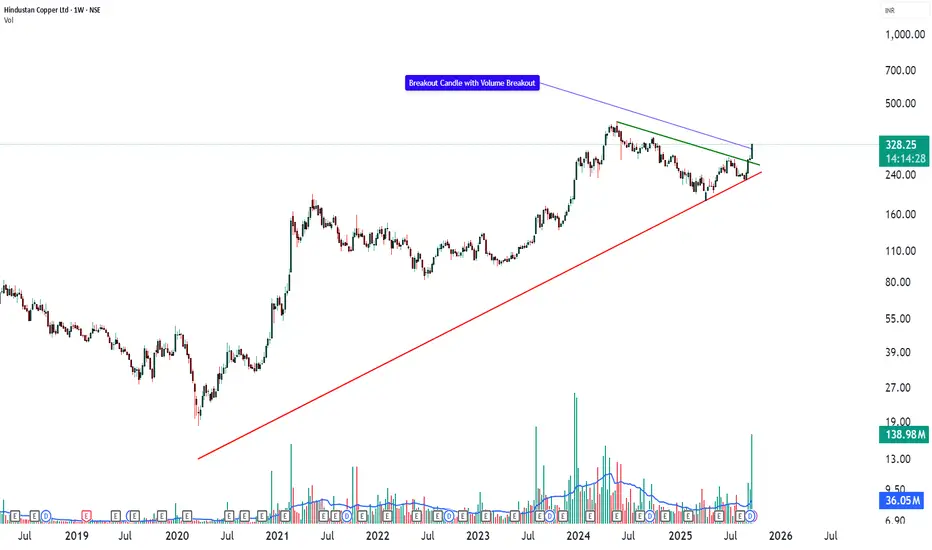
HINDCOPPER _ Multi-Year Triangle BreakoutHindustan Copper (HINDCOPPER) – Multi-Year Triangle Breakout with Educational Trade Analysis
Hindustan Copper Ltd. (CMP: ₹328) has delivered a decisive breakout on the weekly chart. The stock had been compressing within a multi-year symmetrical triangle formed by a rising trendline from the 2020 lows (red) and a descending resistance from the 2022 highs (green). The most recent candle shows a sharp +16% surge with strong volume, pushing price above the descending trendline and signaling a potential continuation of the long-term uptrend.
From a technical perspective, ₹250–260 remains a key support zone, while the next major resistance cluster lies near ₹400–420, which aligns with the measured-move projection from the triangle’s height. This price structure sets up an instructive case study in pattern breakouts for market participants.
Fundamentally, Hindustan Copper enjoys a unique monopoly as India’s only fully integrated copper producer, covering mining through to refined products. It commands a vast resource base of roughly 755 million tonnes of copper ore, providing decades of visibility. Management is working to ramp mining capacity from 4 MTPA to 12.2 MTPA, led by the historic Rakha mine restart and multiple underground expansions. FY25 was a landmark year with ₹2,071 crore revenue and ₹469 crore PAT, and Q1 FY26 has already delivered an ~18 % YoY PAT growth. The balance sheet is healthy and nearly debt-free, offering flexibility to fund expansion.
On the macro side, global copper demand is in a structural uptrend, driven by EV adoption, renewable energy installations, and power-grid upgrades. Supply disruptions at major global mines have tightened the market, creating a favorable price backdrop for Hindustan Copper.
📝 Educational Trade Analysis
For traders studying breakouts, this setup offers a clear example of blending chart structure with fundamental support. A typical learning plan could observe a hypothetical entry zone on a sustained close above ₹335–340, with illustrative targets near ₹400 and ₹450, which correspond to the pattern’s measured move. A protective stop for case-study purposes might be placed around ₹295, just below the breakout and the 50-week moving average.
These levels are for educational illustration only—not a recommendation to buy or sell.
This integrated perspective shows how a commodity-backed PSU with strong fundamentals and an expansion pipeline can align with a technically significant breakout, offering a valuable lesson in combining price action with fundamental drivers.
⚠️ Disclosure & Disclaimer – Please Read Carefully
I/we have no financial interest or position in Hindustan Copper at the time of writing.
The information shared here is meant purely for learning and awareness. It is not a buy or sell recommendation and should not be taken as investment advice. I am not a SEBI-registered investment adviser, and all views expressed are based on personal study, chart patterns, and publicly available market data.
Trading—whether in stocks or options—carries risk. Markets can move unexpectedly, and losses can sometimes exceed the money you have invested. Past performance or past setups do not guarantee future results.
If you are a beginner, treat this as a guide to understand how the market works and practice on paper trades before risking real money. If you are experienced, always assess your own risk, position sizing, and strategy suitability before entering trades.
Consult a SEBI-registered financial adviser before making any real trading decision. By engaging with this content, you acknowledge full responsibility for your trades and investments.
💬 Found this useful?
🔼 Give this post a Boost to help more traders discover clean, structured learning.
✍️ Drop your thoughts, questions, or setups in the comments — let’s grow together!
🔁 Share with fellow traders and beginners to spread awareness.
👉 “If you liked this breakdown, follow for more clean, structured setups with discipline at the core.”
🚀 Stay Calm. Stay Clean. Trade With Patience.
Trade Smart | Learn Zones | Be Self-Reliant 📊
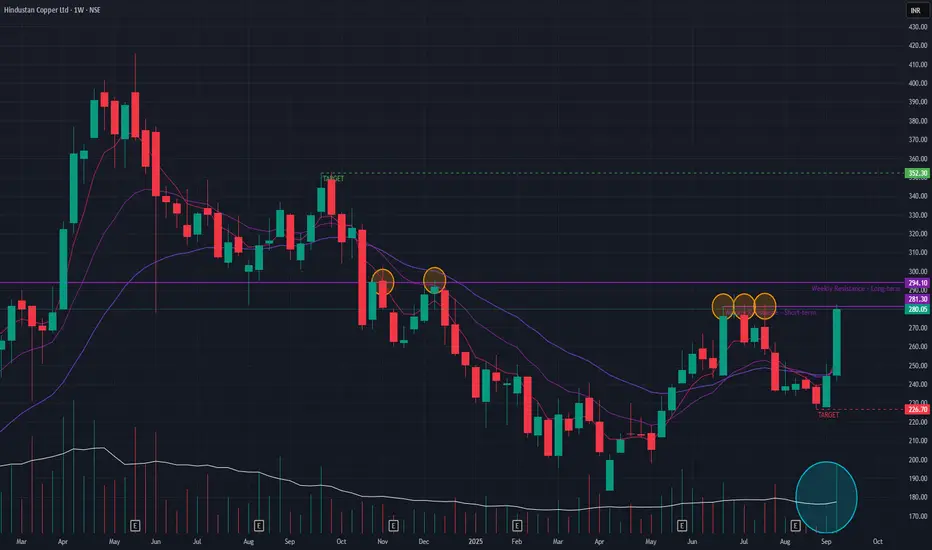
Hind Copper (Weekly Timeframe) - Potential BreakOut Candidate ??After a multi-year uptrend concluding in May 2024, Hindustan Copper entered a corrective downtrend. However, a potential reversal has been forming since April 2025, evidenced by a pattern of higher lows and a constructive setup in its short-term Exponential Moving Averages (EMAs).
This shift in sentiment has been confirmed by a powerful +23.5% rally over the past two weeks, backed by immense trading volume. For the uptrend to continue, the stock must overcome two key hurdles: a near-term horizontal resistance and, more importantly, a multi-year resistance trendline dating back to March 2012. A sustained breach of this long-term resistance would be a significant technical event, potentially paving the way for a move toward ₹352 . Should the breakout fail, a pullback to the ₹226 support zone is possible.
To be monitored !!
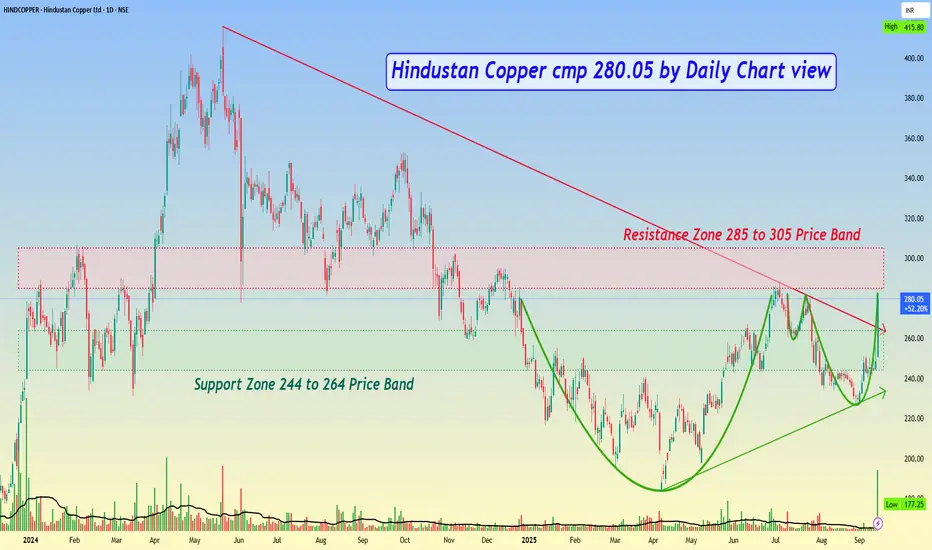
Hindustan Copper cmp 280.05 by Daily Chart viewHindustan Copper cmp 280.05 by Daily Chart view
- Support Zone 244 to 264 Price Band
- Resistance Zone 285 to 305 Price Band
- Huge Volumes surge by demand based buying
- Falling Resistance Trendline Breakout sustained closure
- Support Zone got well tested and retested over past few days
- Bullish Rounding Bottoms formed by the Resistance Zone neckline
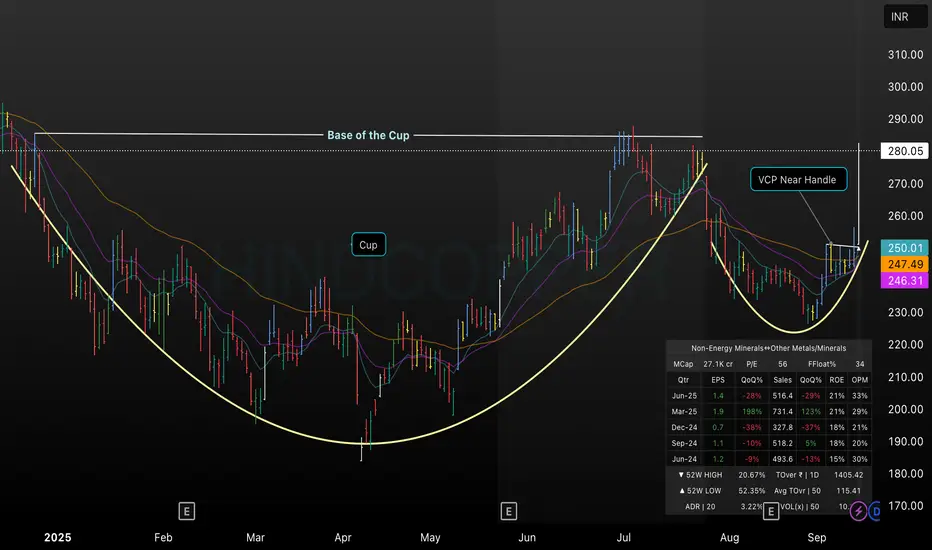
HINDCOPPER Cup & Handle Breakout: VCP Formation AnalysisThis chart showcases a classic Cup and Handle pattern on HINDCOPPER, with a clear base at 280. The handle displays a developing VCP (Volatility Contraction Pattern), signaling potential for an upside breakout. Key moving averages support the structure, and momentum appears strong following a 12.66% price surge. This setup illustrates how blending Cup & Handle with VCP can refine entry points and risk management for active traders.
A buying opportunityHindcopper CMP 241
Elliott - I had noticed the 5 waves in the rally from the lows. Hence this correction becomes an opportunity to buy. This rally will be the 3rd wave and hence will be a strong one. The Fib ext will guide u to the probable tgts.
Fibs - the stock is now taking higher fib zones as support, indicating strength.
RSI - the oscillator back to its bull support is telling me the trend is intact.
Conclusion - the stock is still down some 40% from the highs and is offering a good opportunity. Similar set up is there in SAIL as well hence a rally is a high probability.

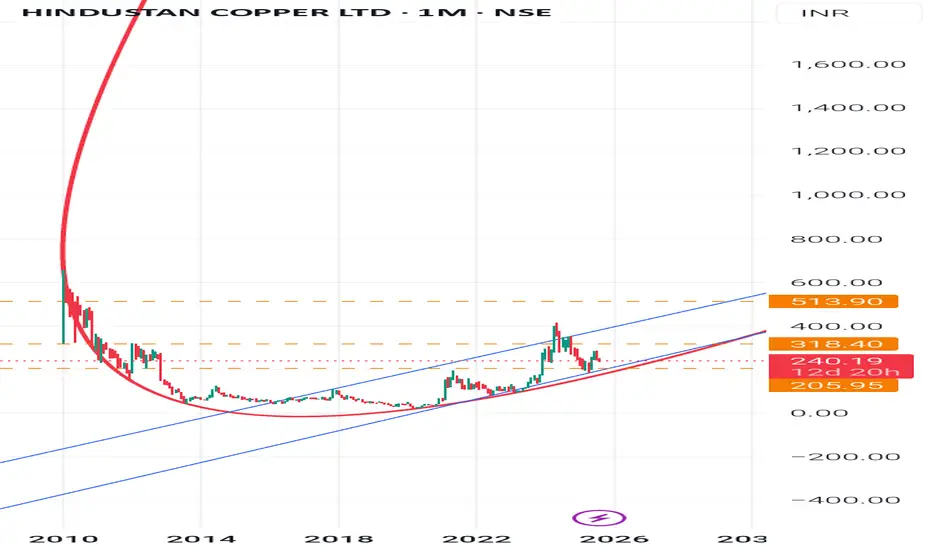
Hindustan copper Trend AnalysisHindustan Copper (HINDCOPPER) - Monthly Chart : Trend Analysis-
Long-term Trend: Strong uptrend since 2020, visible with higher highs and higher lows.
Current Position: After a sharp rally to 414, the stock corrected and is now consolidating around 280.
200-Month MA (red curve): Acts as a strong long-term support trendline.
Chart Pattern👉
Cup & Handle Formation: The stock formed a long cup (2010-2020) and has broken out. Now it is forming a handle/consolidation phase.
Rising Channel: Price is moving inside an upward channel (blue lines).
Support Levels
1. 240 - Strong immediate support (monthly close basis).
2. 205 - Next strong support (channel + trendline confluence).
3. 165- Major base (only if bigger correction comes).
📈 Resistance Levels
1. 318- First hurdle (recent swing high).
2. 414- Previous top, very important resistance.
3. 513- Long-term target zone shown on your chart.
🚀 Next Big Leap🎯
If stock sustains above 318, momentum buying can take it back toward 414.
A monthly close above 414 will confirm a fresh breakout, next big target opens to 513-550 zone.
In the longer run (2-3 years), if 513 is crossed and sustained, stock could head towards 750+.
Risk Note:
Below 240 on monthly close- weakness.
Below 205- trend reversal risk (long-term investors must watch this level closely).
Summary:
Hindustan Copper is in a long-term bullish structure. It is currently consolidating in a handle phase between 240-318. A breakout above 318 can lead to a retest of 414, and then a big move towards 513+. Long-term investors should stay put as long as 205 support holds.
Disclaimer-
This analysis is only for educational and learning purposes.
It is not an investment or trading advice.
Stock market investing is risky- please consult a SEBI-registered financial advisor before making any decisions.
#StockMarket #TechnicalAnalysis #PriceAction
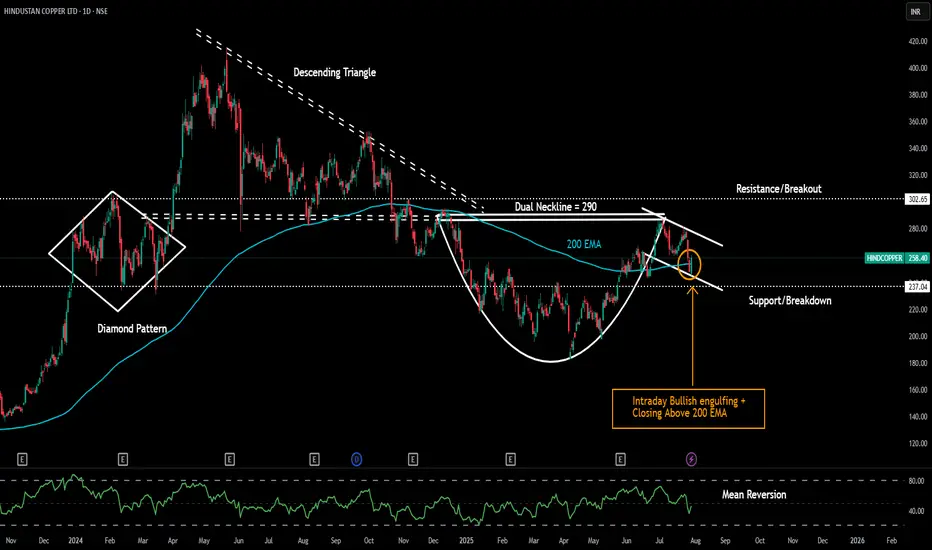
Hindustan Copper LtdDate 29.07.2025
Hindustan Copper Ltd
Timeframe : Day Chart
Technical Remarks :
1 Formed bullish engulfing on intraday closing basis
2 Closed above 200 exponential moving average
3 Took support from handle's bottom base
4 Dual neckline at 290 of descending triangle + cup & handle pattern
5 302 is another resistance after that high momentum journey
6 Keep todays low at 245 or 200 ema as strict stoploss on trailing basis
About The Company :
Main Products
1) Continous Cast Copper rod
2) Copper Cathode
3) Copper Concentrate
By-products
1)Copper Sulphate
2)Sulphuric acid
3) Anode Slime
4) Nickel hydroxide
5) Reverts
Plant Location
Taloja in Maharashtra
Jhagadia in Gujarat
Ghatsila in Jharkhand
Malankjand in Madhya Pradesh
Khetrinagar in Rajasthan
Revenue break up
Domestic sales - 43%
Export sales -57%
Exports sales - Product wise
Copper concentrates- 94%
Copper reverts- 2%
Anode slime - 4%
Valuations
Roce = 24%
Roe = 19%
Pe Ratio = 53
Book Value = 9X
Operating Profit Margins = 36%
Holding Pattern :
Promoter = 66.14%
DII = 3.71%
FII = 8.24%
Public = 21.90%
Regards,
Ankur
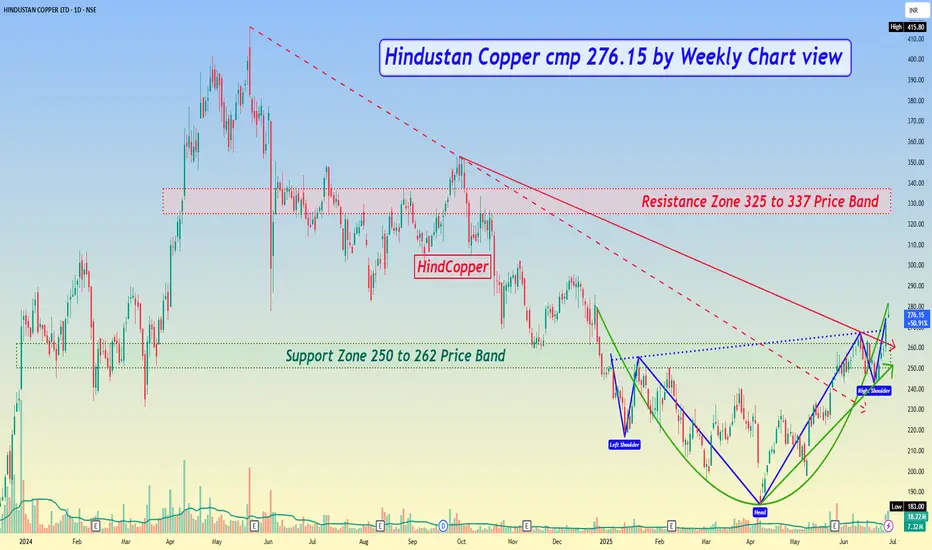
Hindustan Copper cmp 276.15 by Weekly Chart view*Hindustan Copper cmp 276.15 by Weekly Chart view*
- Support Zone 250 to 262 Price Band
- Resistance Zone 325 to 337 Price Band
- All major Technical indicators BB, EMA, MACD, RSI trending positively
- Stock is seen trending with positive momentum on Daily and Weekly Charts
- Rising Support Trendline respected with Falling Resistance Trendline Breakout
- Bullish Head & Shoulders pattern within Bullish Rounding Bottom seen completed
- Volumes are getting attractive and spiking heavily above the average traded quantity
- Stock seems to have tested and retested the Support Zone and attempting upwards momentum
HINDCOPPER | Supply-Demand Flip & Structure This chart shows a clean structural shift on the weekly timeframe for Hindustan Copper Ltd (NSE: HINDCOPPER):
🔷 Blue Zone: A key Supply-to-Demand Flip area. Price reacted strongly from this zone after multiple touches, showing its relevance.
📉 CT Line (Compression Trendline): Price was getting compressed under this trendline. It's now visibly breached.
➡️ Arrow Zone: Highlights a smaller supply-demand zone, formed after consolidation and breakout. Marked for structural clarity.
Volume also shows higher activity during this move, indicating strength behind the recent price action.

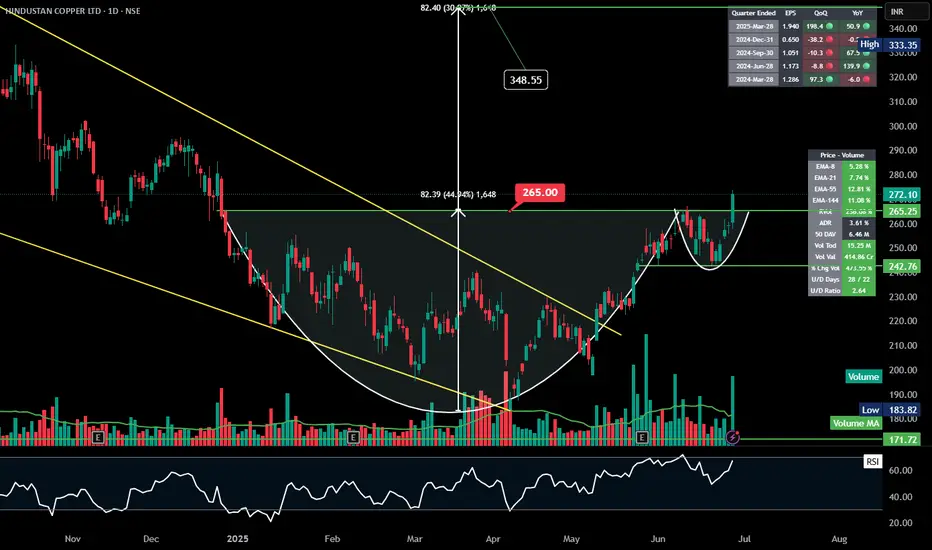
HINDCOPPER |CupandHandle Breakout! #HINDCOPPER - #CupandHandle Breakout!
Price breaks above ₹265 with strong volume
can test: ₹348.55 (+30.9%) Support - 265
EMAs stacked bullish, momentum building!
#StocksToWatch #Breakout #TechnicalAnalysis #NSE
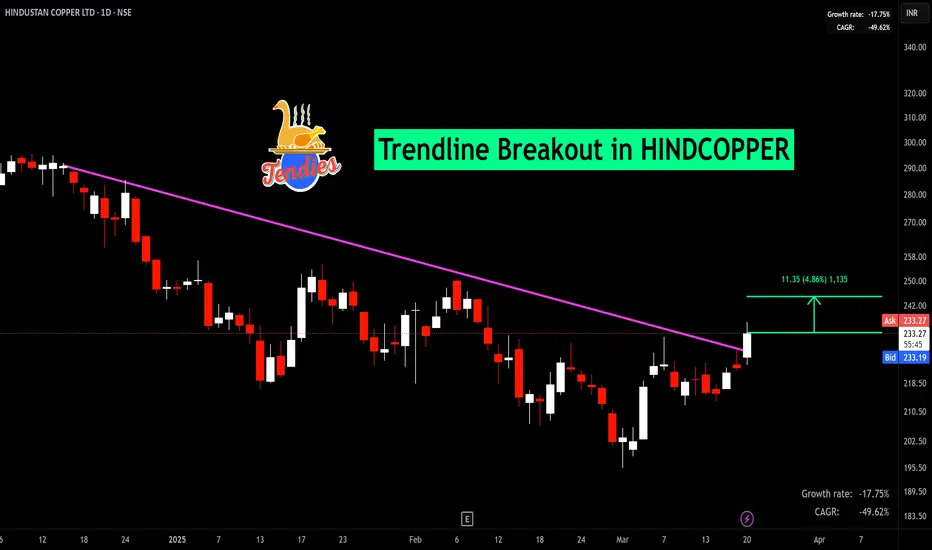
BUY TODAY SELL TOMORROW for 5%DON’T HAVE TIME TO MANAGE YOUR TRADES?
- Take BTST trades at 3:25 pm every day
- Try to exit by taking 4-7% profit of each trade
- SL can also be maintained as closing below the low of the breakout candle
Now, why do I prefer BTST over swing trades? The primary reason is that I have observed that 90% of the stocks give most of the movement in just 1-2 days and the rest of the time they either consolidate or fall
Trendline Breakout in HINDCOPPER
BUY TODAY SELL TOMORROW for 5%
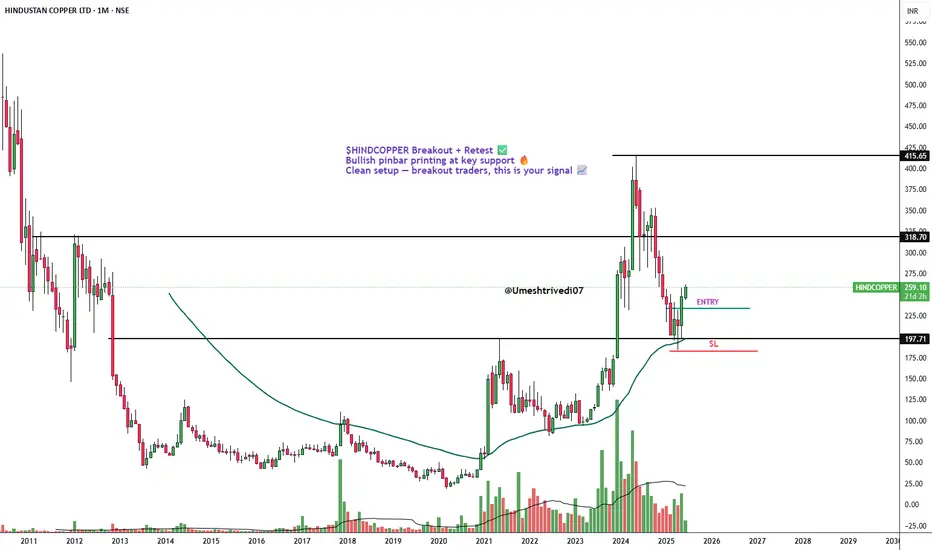
HINDCOPPER Chart Setup reakout + Retest + Bullish Pinbar!NSE:HINDCOPPER has broken out of a key resistance and is now retesting the zone with a strong bullish pinbar formation — a textbook price action setup suggesting possible continuation to the upside.
📈 Trade Setup (for educational purposes):
Entry: ₹233
Stop-Loss: ₹180
Type: Swing trade / Price action-based setup
📈 Setup looks ideal for swing traders watching for trend continuation.
💬 What’s your view on NSE:HINDCOPPER ? Comment below!
#HINDCOPPER #Breakout #Retest #BullishPinbar #NSE #SwingTrading #PriceAction #TradingView
⚠️ Disclaimer:
This analysis is for educational and informational purposes only. It does not constitute financial advice or a recommendation to buy or sell any securities. Always do your own research and consult with a licensed financial advisor before making trading decisions.
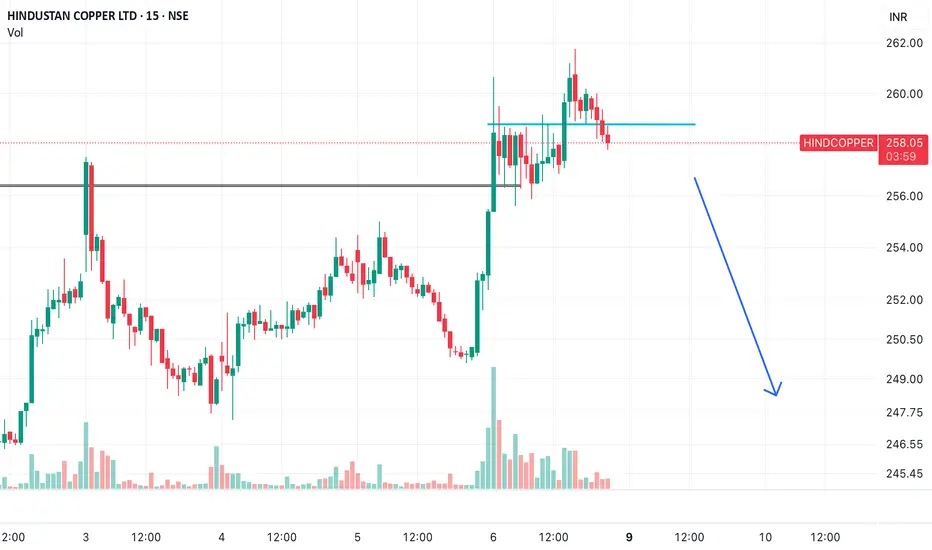
Time to Short the Spark Out of Hindustan Copper
Trade Type:
Short – Breakdown Trade (Technical)
Rationale:
Hindustan Copper (NSE: HINDCOPPER) is exhibiting a classic intraday breakdown below its immediate support level near ₹258, confirmed on the 15-minute chart. The stock attempted to hold above the ₹260 consolidation range but failed to sustain, triggering a bearish setup.
Recent price action indicates distribution after a strong vertical rally, followed by lower highs and a clean support retest. The breakdown is accompanied by declining volume on the retest and loss of buying interest, suggesting increased probability of a short-term retracement.
This short call is purely tactical and is based on weakness in short time frames. There are no fundamental changes to the long-term outlook at this time.
Trade Details:
• Entry: Sell below ₹257.80
• Stop Loss: ₹260.20 (above resistance retest)
• Targets:
• T1: ₹252.50
• T2: ₹248.00
• Extended: ₹245.00 (only if momentum sustains)
Risk Management:
• Risk-to-reward ratio: Approx. 1:2.5 (for first two targets)
• Position sizing should be conservative, considering general market volatility and sectoral strength in metals.
Remarks:
No confirmation from broader commodity cues; this is a structure-led trade. Any intraday bullish reversal or closing back above ₹260 will negate the setup.
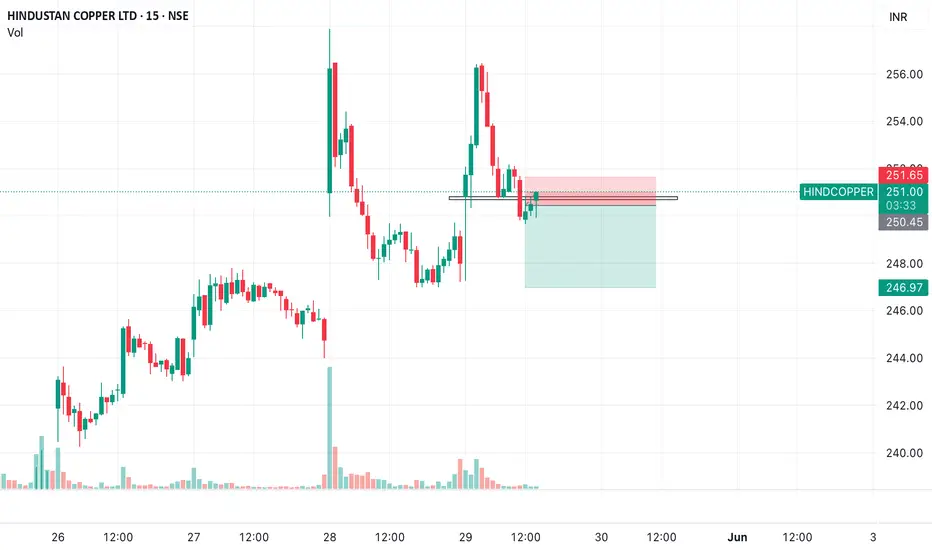
Intraday Short on HindCopperFound a great analysis of Mr Murthy_Santhosh. Just building on top of that. I feel there is a good setup seen for an intraday short on HindCopper.
15min Timeframe:
CMP:250.75
SL: 251.75
Target: 247
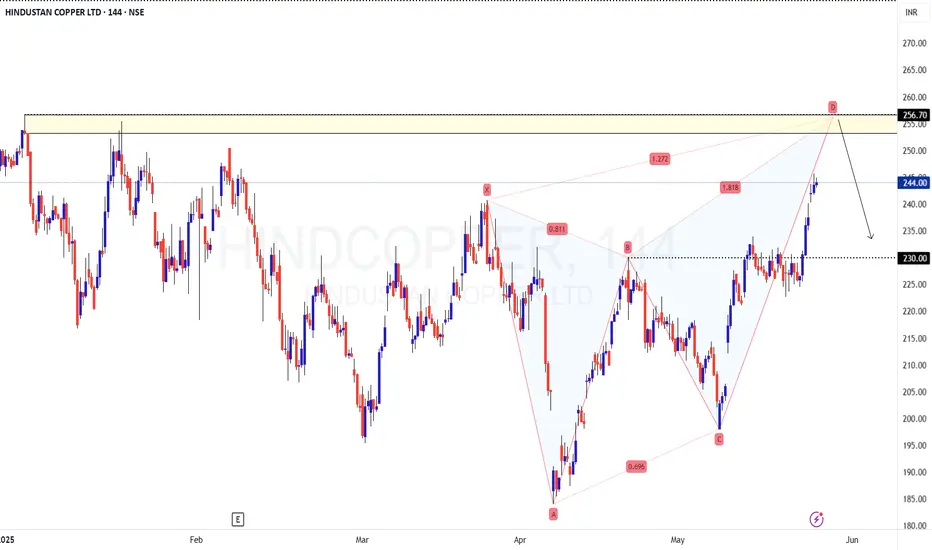
HINDCOPPER - BEARISH BUTTERFLY PRZ at 255 (Short term)Seems that Bearish Butterfly Harmonic pattern is in play. Butterfly patterns usually gets rejected at the 1.27 extension mark (here, it is at 255 zone)
The zone of 255 also happens to be the previous supply zone (marked herein) and it is prudent to book profits at this level and wait for a meaningful pullback.
With this move towards 255, the price will be breaking out from the falling trendline on daily TF and would set up for a fresh breakout trade (but entry at the lower level is ideal though)
As far as this butterfly pattern is concerned, it gets invalidated if the price moves past 260
The LH-LL formation has been negated already with today's move and we are eying for a trend reversal play here.
Overall, the stock looks to be bullish and we should be eying on meaningful pullback to enter.
Disclaimer: I am not a SEBI registered Analyst and this is not a trading advise. Views are personal and for educational purpose only. Please consult your Financial Advisor for any investment decisions. Please consider my views only to get a different perspective (FOR or AGAINST your views). Please don't trade FNO based on my views. If you like my analysis and learnt something from it, please give a BOOST. Feel free to express your thoughts and questions in the comments section.
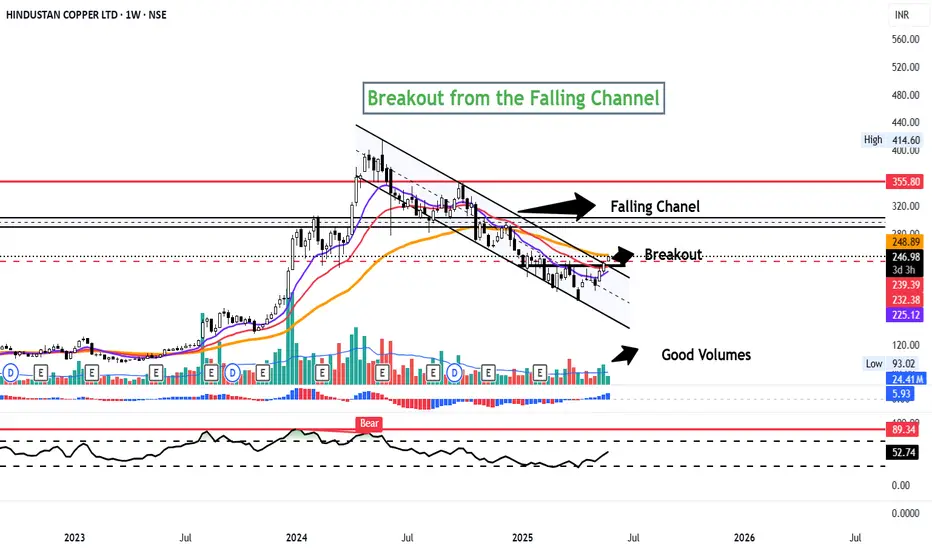
Breakout from the Falling Parallel ChanelHindustan copper has broken out from the falling Parallel Channel formed on the weekly charts.
This channel was unbroken from April'24. The stock has reclaimed its 11 and 22 week ema and about to trade above 50 week ema placed at 249.
The stock is looking good to trade on the upside with the immediate target being Rs.295 which is a major supply zone.
CMP- Rs.246
Short Term Target-295
SL- 221
Disclaimer: This is not a buy/sell recommendation. For educational purpose only. Kindly consult your financial advisor before entering a trade.
Database Trading part 3Trading data is typically collected from stock exchanges such as the New York Stock Exchange (NYSE) or NASDAQ. This can be a useful source for trades that are made over the listed exchanges and can provide many different data poitns, such as trade prices and times.

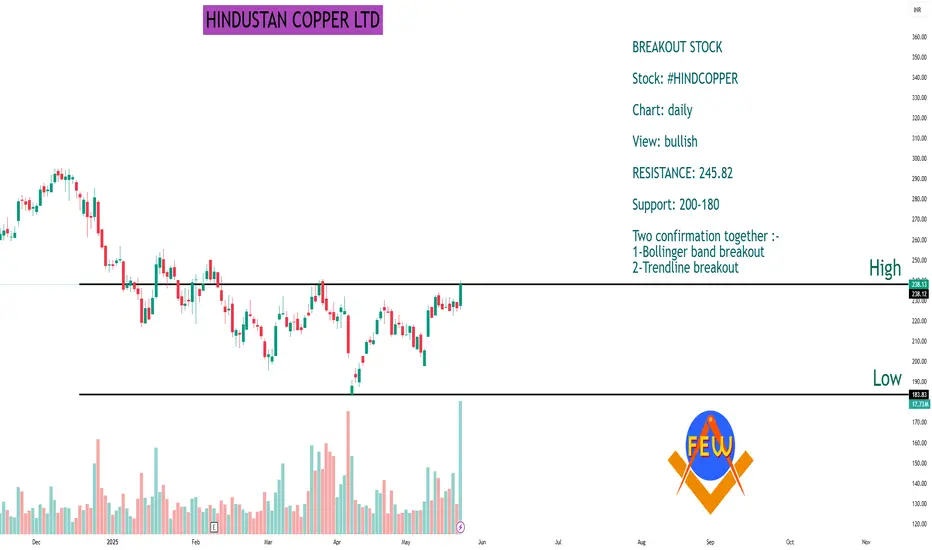
HINDUSTAN COPPER LTDBREAKOUT STOCK
Stock: #HINDCOPPER
Chart: daily
View: bullish
RESISTANCE: 245.82
Support: 200-180
Two confirmation together :-
1-Bollinger band breakout
2-Trendline breakout