HINDCOPPER - BuyGood weekly chart
Indicating downtrend reversal on daily chart with strengthening MACD
Stock outperforming market.
Buy , at CMP or 150 levels
Stop - 130
HINDCOPPER trade ideas


Hindustan Copper looks good!
Buy at CMP for targets of 170/185
Good Volume and accumulation
Please do your own analysis before making any decisions and also let me know if I missed something.
Let's learn together.

Hindcopper LongHindcopper Long
Strong support at 141 (100 day EMA and 20 Week EMA) also crossed all EMA's with good volumes
Buy above 156.5 (on closing basis)
SL- 141
Target- 173, 188
Disclaimer- We are not SEBI registered advisor.
Charts and views are only for educational purpose.

Time to go long!After Break Out on Daily Time Frame, stock has retested BO and looking all set for 1st target of 172. Stay long!

HINDUSTAN COPPER LOOKING BULLISHShort term trade idea: Trendline breakout in Hindustan copper. Buy at cmp, target: 170, sl: 140, horizon: 28 days.

Hindustan Copper Falling wedge pattern & Bullish kickerFalling wedge pattern ( black lines ) breakout.
The falling wedge pattern is interpreted as both a bullish continuation and bullish reversal pattern which gives rise to some confusion in the identification of the pattern. Both scenarios contain different market conditions which must be taken into consideration.
The differentiating factor that separates the continuation and reversal pattern is the direction of the trend when the falling wedge appears. A falling wedge is a continuation pattern if it appears in an uptrend and is a reversal pattern when it appears in a downtrend.
Here it is appearing in uptrend. Hence continuation pattern.
Continuation or (Reversal) Pattern:
1.Identify an uptrend or (downtrend)
2.Link lower highs and lower lows using a trend line. The two lines will slope downwards and converge
3.Look for divergence between price and an oscillator like the RSI or stochastic indicator
4.Oversold signal can be confirmed by other technical tools like oscillators
5.Look for break above resistance for a long entry
Key points to remember:
1.Identification of the trend is crucial
2.Both continuation and reversal scenarios are inherently bullish
3.Both patterns present favorable risk to reward ratios as they generally precede big moves
Here is how you identify a bullish kicker:
1.The pattern starts with a bearish (red/black) candle
2.The second candle gaps to the upside, and opens above the previous day’s close. It continues straight up and ends as a bullish candlestick.
3.The gap should not be filled by the wick of the second candlestick, but be left untouched. In other words, the candlestick has a tiny or non-existing lower wick.
The pattern occurs after a downtrend, it instead might be a sign that the market has gone too far, and is about to revert. Here the bullish kicker becomes a sort of reversal pattern.
The first candle in the signal continues with the current trend, moving downward, but then a major event causes the second candle to gap up. The price bursts upward with bullish enthusiasm. Thus, the Bullish Kicker candlestick pattern portrays a strong change in investor opinion. Not only is there a bullish candle following a bearish candle, but the strength of the switch resulted in a gap between the two candles.
The Bullish Kicker signal often occurs after a major surprise in the news that is announced before or after market hours. Something drastic has happened, causing a great shift in investor sentiment, and a reversal will inevitably follow. The larger the gap between the two candles, the more significant the signal.
Combining chart patterns with other technical indicators wave out any false signal if generated. Therefore adding any one of the other indicators like Volume, Stochastic, RSI, MACD support etc. with chart patterns, one can further enhance the probability of the pattern to happen.

Hinudstan copper, still long way to go.Accumulation: Wyckoff Events
PS—preliminary support , where substantial buying begins to provide pronounced support after a prolonged down-move. Volume increases and price spread widens, signaling that the down-move may be approaching its end.
SC—selling climax , the point at which widening spread and selling pressure usually climaxes and heavy or panicky selling by the public is being absorbed by larger professional interests at or near a bottom. Often price will close well off the low in a SC, reflecting the buying by these large interests.
AR—automatic rally , which occurs because intense selling pressure has greatly diminished. A wave of buying easily pushes prices up; this is further fueled by short covering. The high of this rally will help define the upper boundary of an accumulation TR.
ST—secondary test , in which price revisits the area of the SC to test the supply/demand balance at these levels. If a bottom is to be confirmed, volume and price spread should be significantly diminished as the market approaches support in the area of the SC. It is common to have multiple STs after a SC.
Springs or shakeouts usually occur late within a TR and allow the stock’s dominant players to make a definitive test of available supply before a markup campaign unfolds. A “spring” takes price below the low of the TR and then reverses to close within the TR; this action allows large interests to mislead the public about the future trend direction and to acquire additional shares at bargain prices. A terminal shakeout at the end of an accumulation TR is like a spring on steroids. Shakeouts may also occur once a price advance has started, with rapid downward movement intended to induce retail traders and investors in long positions to sell their shares to large operators. However, springs and terminal shakeouts are not required elements: Accumulation Schematic 1 depicts a spring, while Accumulation Schematic 2 shows a TR without a spring.
Test —Large operators always test the market for supply throughout a TR (e.g., STs and springs) and at key points during a price advance. If considerable supply emerges on a test, the market is often not ready to be marked up. A spring is often followed by one or more tests; a successful test (indicating that further price increases will follow) typically makes a higher low on lesser volume.
SOS —sign of strength, a price advance on increasing spread and relatively higher volume. Often a SOS takes place after a spring, validating the analyst’s interpretation of that prior action.
LPS —last point of support, the low point of a reaction or pullback after a SOS. Backing up to an LPS means a pullback to support that was formerly resistance, on diminished spread and volume. On some charts, there may be more than one LPS, despite the ostensibly singular precision of this term.
BU —“back-up”. This term is short-hand for a colorful metaphor coined by Robert Evans, one of the leading teachers of the Wyckoff method from the 1930s to the 1960s. Evans analogized the SOS to a “jump across the creek” of price resistance, and the “back up to the creek” represented both short-term profit-taking and a test for additional supply around the area of resistance. A back-up is a common structural element preceding a more substantial price mark-up, and can take on a variety of forms, including a simple pullback or a new TR at a higher level.
Text taken from school.stockcharts.com
Note : You'll never get everything as per text book theory. You always need to modify some parts as required. Bookish knowledge and reality is not exact.
Probable profit booking zones.
Review the charts at each level, book profit accordingly.
Targets are set based on my observations of various stocks like NSE:TANLA , BSE:VENKYS , NSE:MASTEK etc. you can check monthly charts and compare it with this chart.
Your own analysis is expected before taking potions. Blindly following and entering can land you in trouble. Don't get carried away by targets as they are multibagger type. Analyze at each level and book profit accordingly. Nothing works 100% in live market, you need to act accordingly to the changing circumstances.


Hindcopper#hindcopper CMP 155
If Close Above 155 then
Trgt 165/170
Trade as per your conviction
Just for educational purpose


Weekend Analysis - Short term BreakoutShortterm study
-Hindustan copper looks good for long term
- Trade when the breakout happens or
- Buy below 134 for better risk to reward ratio.
- Team Stock explorers

Hindustan Copper25-Jul-2021
Hindustan Copper is in process of breaking out of triangle.
Buy 144, SL 125, TP 190+ & more

DECENDING TRENDLINE BO AFTER MOVING DOWN FOR A LONG TIME IT HAS GIVEN A BP OF THE DECENDING TRANDLINE
CROSSES 151
CAN MOVE TILL- 184
1-2 MONTHS

HINDCOPPERBREAK OUT FROM FALLING WEDGE ABOVE 145 CAN LEAD IT TO 173-239. THERE IS A POSSIBILITY THAT IT CAN REPEAT THE MOVEMENT IT DID FROM 55-165. STRONG SUPPORT AT 133.

Trend line breakout in Hind CopperThe stock has been consolidating for nearly a month in the range of 135-150, breakout from this range can lead the stock price to a level of 168-170, supported by strong volume and metal indices. SL can be kept below 134.95 for a given target.


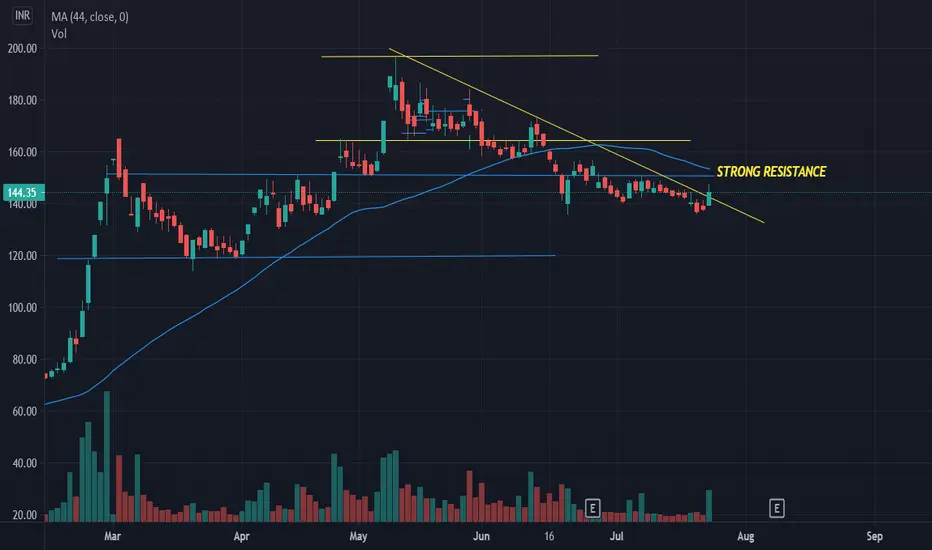
Hind copper getting ready for upmoveThe stock has been in constant downtrend for last 3 months, respecting a trendline. Yesterday it reversed from 100 EMA with volume.
151 is a strong resistance - if broken with high volume we can expect 165 and 184 targets in 1-2 months.

HINDUSTAN COOPER LIMITED THIS IS AN GOVERNMENT OWNED COMPANY, THIS STOCK IS TRYING TO GIVE BREAK OUT IF IT CROSSES THE TRENDLINE IT CAN ACHIVE THE TARGET IT HAS STRONG SUPPORT AT 136 . ONE CAN ENTRY AT 140 TO 145 , STOPLOSS AT- 131. THE VOLUME IS INCREASING DRASTICALLY . DUE TO INCRESING COOPER PRICE AND EXPORTING IT CAN GIVE GOOD RETURN IN MEDIUM TERM .

Hind Copper Volume Compression and Triangle pattern. Close above today's high can make it end it's short term bear leg.

Last hope support at 130 buy if took suprt and cross trendline Last hope support at 130 buy if took suprt and cross trendline

