Hindustan Copper Ltd. (HINDCOPPER) Price Analysis **Date:*#### **Current Price and Intraday Movement**
- **Latest Price:** ₹237.98 (+5.09% / +₹11.52)
- **Day’s Range:** ₹225.50 – ₹240.10
- **Open:** ₹227.60
- **Previous Close:** ₹226.46
- **Volume:** 1.63 crore shares (well above average daily volume of 55.89 lakh)
#### **Technical Overview**
- **52-Week Range:** ₹183.82 – ₹381.90
- **50-Day Average:** ₹216.99
- **200-Day Average:** ₹260.58
- **Market Cap:** ₹23,013 crore
- **P/E Ratio:** 57.48
- **EPS:** ₹4.14
#### **Recent Performance and Trends**
- **Short-Term Trend:** The stock surged over 5% today, outperforming its sector and showing strong buying interest .
- **Volume Spike:** Today’s volume is nearly triple the average, indicating heightened trader participation .
- **Technical Position:** The stock is trading above its 50-day moving average but remains below the 200-day average, suggesting a recovery from recent lows but still under medium-term resistance .
- **Support/Resistance:** Immediate resistance is near ₹240–₹249 (upper circuit), with support at ₹225 and ₹216 (50-DMA) .
#### **Fundamental Snapshot**
- **Valuation:** High P/E ratio (57.48) signals expensive valuation relative to earnings .
- **Profitability:** EPS at ₹4.14; profit margins have been under pressure.
- **Industry Position:** Hindustan Copper is India’s primary copper producer, with exposure to global copper price trends and domestic infrastructure demand.
#### **Outlook**
- **Short-Term:** Strong momentum and volume could drive further upside if it breaks above ₹240, but overbought conditions may trigger profit booking near resistance.
- **Medium-Term:** Needs to sustain above the 200-DMA (~₹260) for a confirmed trend reversal.
- **Risks:** High valuation and recent volatility; global commodity price swings can impact earnings.
---
**Summary:**
Hindustan Copper is showing robust short-term momentum with strong volume and price gains, but faces resistance near ₹240–₹249. The stock remains fundamentally expensive, and investors should watch for sustained moves above the 200-DMA for a longer-term bullish signal .
HINDCOPPER trade ideas
HINDCOPPER : Accumulate Before the Surge – Targets 271-292Weekly Chart Overview:
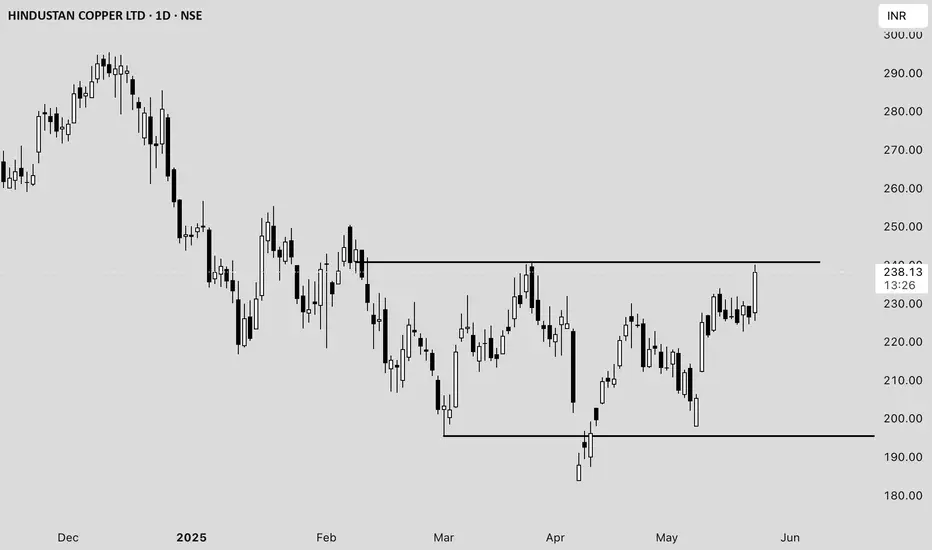
The stock has given a weekly breakout above the key level of ₹217.
Current Market Price (CMP): ₹226.60 (as of last two weeks' data).
The breakout confirms medium-term bullish sentiment.
Daily Chart & Wyckoff Method Analysis:
According to the Wyckoff Method, the stock shows slightly weak momentum currently.
Preliminary Support (PS) identified at ₹243, which also marks a Break of Structure (BOS) zone.
Last Point of Support (LPS) is identified at ₹212, making this a strong accumulation zone.
A stop-loss should be placed at ₹195, just below the recent swing low with a buffer for volatility.
Entry & Target Strategy:
Strict entry confirmation: Daily close above ₹234.50.
Target 1: ₹271
Target 2: ₹292
Stop : ₹195 (Risk management / swing low)
📌 Only initiate positions if the stock closes above ₹234.50 on the daily chart to ensure upward momentum confirmation.
Fundamental Trigger:
Bullish catalyst: News of US-China agreement to slash tariffs on 12 May 2025 has boosted sentiment across metal stocks.
This macro development supports the bullish projection in Hindustan Copper.
Disclaimer: lnkd.in

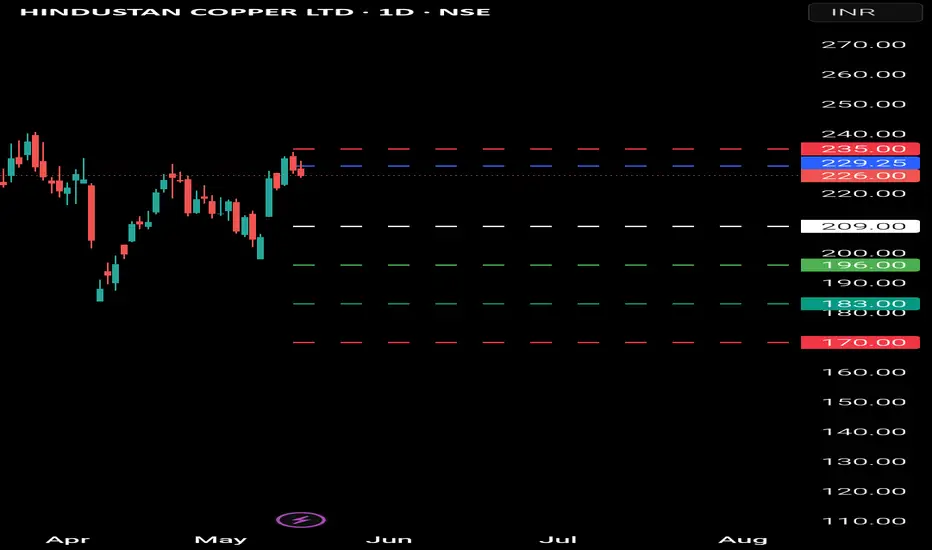
Hindustan Copper Ltd (HINDCOPPER)- Analysis Bullish Levels -if sustain above 235 (early entry risky) then 289 first target (safe entry if sustain above this for a week) target can be around 339 sustain above for a week or two then we expect more upside and wait for targest around 391 then 443 then 495 then 547 then 599 then 651 and last stop would be 703 above this more bullish.
Bearish levels :- if sustain below 209 then 196 to 183 good support if come around this levels add with SL of 170 below this more bearish.
**Consider some Points buffer in above levels
**Disclaimer -
I am not a SEBI registered analyst or advisor. I does not represent or endorse the accuracy or reliability of any information, conversation, or content. Stock trading is inherently risky and the users agree to assume complete and full responsibility for the outcomes of all trading decisions that they make, including but not limited to loss of capital. None of these communications should be construed as an offer to buy or sell securities, nor advice to do so. The users understands and acknowledges that there is a very high risk involved in trading securities. By using this information, the user agrees that use of this information is entirely at their own risk.
Thank you.
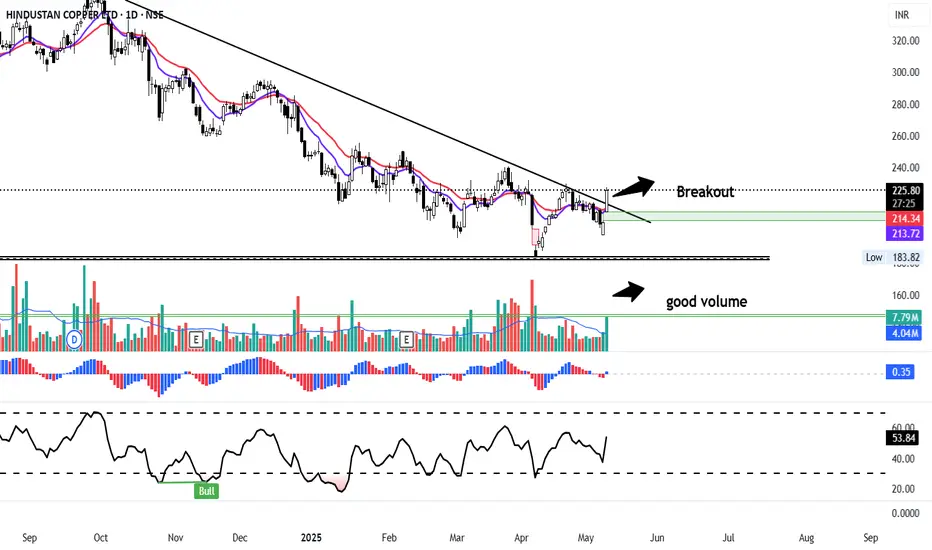
Hindustan Copper- Trendline BreakoutHindustan copper gave a trendline breakout on the daily chart with good volumes.
This trendline was unbroken since Oct 3,24. Hopefully now the stock is ready for a good upmove.
The stock is trading above it 11 and 22 day ema. Rsi is at54 signalling good momentum
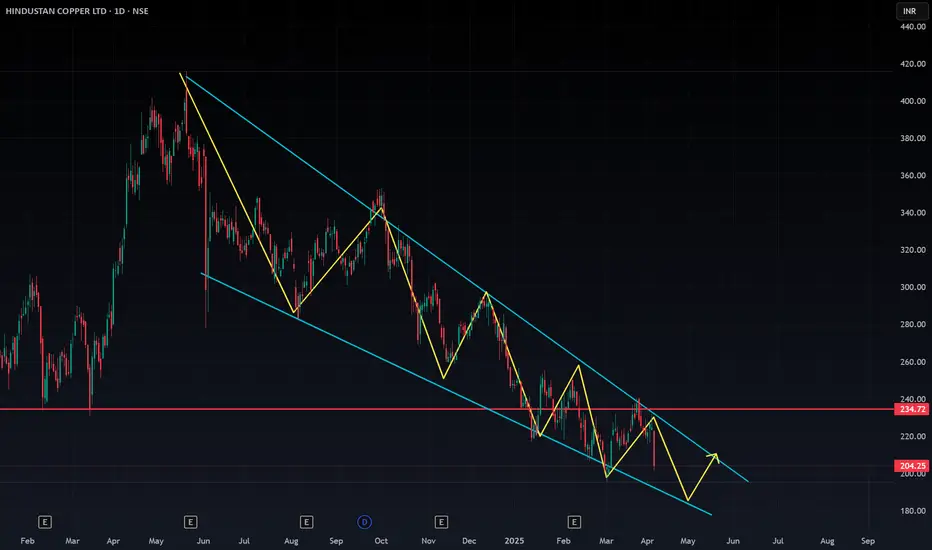
HINDCOPPER - Observation & Hypothesis Sellers vs BuyersEverything is explained within the chart.. Self explanatory.. This is just an hypothesis, maybe a crazy idea/view from someone with long bias on this script..
Nevertheless, In my humble opinion, it is definitely not a place to short at this juncture.
On the wave counts, price is at 50% retracement level, ideal for the 4th wave termination.. as long as 196 is protected, we are in for a ATH to complete the 5th
Wave counts of different timeframes can be located here
I am not a SEBI registered Analyst. Views are personal and for educational purpose only. Please consult your Financial Advisor for any investment decisions. Please consider my views only to get a different perspective (FOR or AGAINST your views). Please don't trade FNO based on my views.

HINDCOPPER Trading Within Weekly Demand Zone (192-177.25)HINDCOPPER is currently trading at 188.23, within its Weekly demand zone range of 192 to 177.25. Investors may watch for potential reactions or reversals from this level.
Disclaimer: This analysis is for informational purposes only and should not be considered financial advice. Please perform your own due diligence or consult a financial advisor before making any investment or trading decisions.
A Falling Wedge Pattern is Witnessed.Not a Good time To Buy as the major market is falling but a Falling Wedge Pattern is Witnessed, keep at watch might become a good choice to buy in the future.
SWING (OBSERVATION) - HINDUSTAN COOPERScipt looks in good momentum cleared trendline resistance & horizontal rejection area (multiple swing) 242 -can retest this to attain higher levels of 260

good for a short term swing to investmentgood accumulation and bottom fishing done, a swing high move soon can be sen once the levels are breached and momentum is gaining

BUY HINDCOPPERBuy hindcopper as it is oversold stock, making inverted head and shoulder also ema crossover giving a strong buy signal.

Hind Copper - Long Term TradeHind Copper Analysis
The stock is currently showing a Cup formation on the weekly time frame. The Relative Strength Index (RSI) is finding support around 38-40 on the same time frame.
An entry point can be considered at the current levels of 260-275. If there are dips, it is advisable to accumulate shares in the 230-250 range.
First target: approximately Rs 400
Second target: in the range of Rs 450-475
Long-term target: between Rs 575-600
Stop Loss: set at Rs 200
Disclaimer: Study only for Educational Purpose.
Remember: My Money, My Risk, My Reward, My Responsibility.
Please Consult your SEBI registered Financial Advisor for any Financial Advice/ Decision.

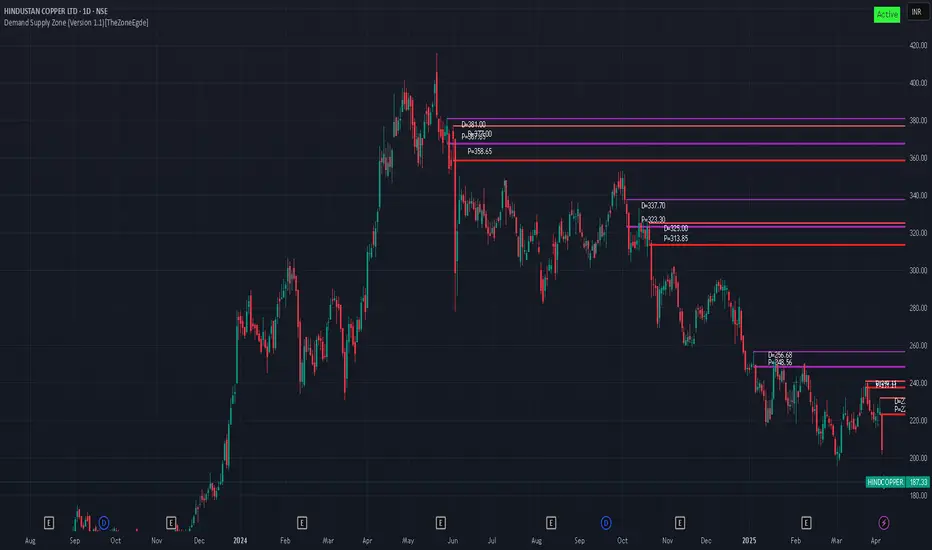
Potential swing option for short/mid term holdHINDCOPPER after making ATH of 415.80 have corrected approx 37% from top. Last trading week, stock have created a base at 260 levels showing sideways movement despite there has been huge volatility in Metal sector. Due to continous FII selling and negative market sentiments expecting 260 level to break and creating more panic for retailers.
However, as per my views, there should be a bounce back from 243/226 zone for further waves. Now, this bounce shall occur either quickly just hitting levels of the marked box or post few days consolidation within the box attracting institutes to accumulate/add at that point.
Personally, I'm looking for an opportunity here for fresh entries at levels within the box for a short/mid term Swing for 20-30% returns with last target of 302/305.
This analysis is just based on my personal views as per demand and supply zones for the stock, therefore, this does not guarantee any future results or returns. Not a buy/sell recommendation.

Hindustan Copper cmp 262.70 by Weekly Chart view*Purely my point of view for the Technical Setup on the Stock Chart for a probable outcome*
Hindustan Copper cmp 262.70 by Weekly Chart view
- Stock seems weak on the Daily and Weekly Charts
- Support Zone at 255 to 260 Price Band, if broken may show up +/- 235
- Weekly basis Support at 229 > 185 > 151 with Resistance at 303 > 340 > 377
- Stock seems attempting to take reversal from Support Zone 255 to 260 Price Band
- Volumes are less attractive and needs to pump up by good numbers for fresh upside

HindCopper Long Term AnalysisHindcopper is breaking through strong resistance levels, and if a daily candle closes above the 348 mark, a potential upward momentum could be anticipated. The trendline has also been broken, further supporting a bullish outlook.

Hindcopper day chart Just for study purposes:Day chart analysis, risk to reward ratio 1:5, take your own decisions with experts helps

Stock to watch Stock to watch
HINDCOPPER
+ Sector looking good
+ Above Key EMAs
+ in a good uptrend
Disc : Charts are shared for educational Purposes only.

hindcopper stock breakout anlaysisHindustan Zinc is a metal sector stock with a market capitalization of Rs 32946 crore, a PE ratio of 90, and a PEG ratio of 6. Based on these valuation metrics, the stock appears overvalued.
However, from a fundamental perspective, the company's solvency ratios are healthy.
Technically, the stock's all-time high is 658, and its current price is trading within a range near 340. There is a potential for a bullish breakout in the stock price around September 25, 2025.
Key Improvements:
Clarity and Conciseness: The text is more concise and easier to understand, eliminating unnecessary repetition and jargon.
Combined Strengths: It effectively merges the strengths of both Response A and Response B, providing a comprehensive analysis of the stock's valuation, fundamentals, and technical outlook.
Objectivity: The analysis maintains objectivity, presenting both positive and negative aspects of the stock without making overly bullish or bearish claims.
Actionable Insight: The conclusion provides a clear actionable insight for investors, suggesting a potential buying opportunity based on the technical analysis.

Breaking Out, Supporting 200 EMA in Accul. ZoneNSE:HINDCOPPER is breaking out of key levels with strength respecting 200 EMA, which was accumulated between 290 and 320 Zones.
With China's Stimulus and Rate Cut ExpectationsCopper Prices have risen. Nifty Metal also Went up Today.
Disclaimer: This analysis is intended solely for informational and educational purposes and should not be interpreted as financial advice. It is advisable to consult a qualified financial advisor or conduct thorough research before making investment decisions.

HINDUSTAN COPPERA possible view for HINDCOPPER in short term. The script is forming an inverted H&S pattern on daily timeframe. The script seems to be in wave iii of wave 1 or larger wave 5 (on weekly timeframe). But for the purpose of this post, from a FIB perspective, we have completed wave 1 and wave 2 (at 0.618) retracement and are now advancing in wave 3 with an immediate target of 370.
Watching closely!

Hindustan Copper Date 17.09.2024
Hindustan Copper
Timeframe : Day chart
Trade Set-up
For Long/Buy side :
Enter on breakout closing of cloud + descending angle of triangle pattern having bounce from 20 ema & 60 ema . Keep 20 ema & 60 ema as stoploss on closing basis. This set up will be more useful for swing trading. Rsi above 50 will act as trend confirmation & trend continuation
For Short/ Sell side :
Enter when price closes below 200 ema + cloud + below neckline. Rsi below 50 will confirm the breakdown & trend continuation. If next day crosses the low after closing below mentioned above set-up then high momentum breakdown intraday basis.
Regards,
Ankur

Turning Bullish: Hindustan CopperHindCopper has been in a consolidation zone for the past four months.
It has been trading in a tight range betwen 300 - 340 levels.
20EMA is just crssing 50 EMA, if it decisively stay above 50 EMA we can expect a good run.


HINDCOPPER STOCKNSE:HINDCOPPER Stock is likely to break out of an inverse head & shoulder pattern.
Buy around 328 to 332 rupees.
Target 1 is 338 to 340 rupees.
Target 2 is 350 to 356 rupees.
Stoploss below 310 rupees (One Day Candle Closed).
