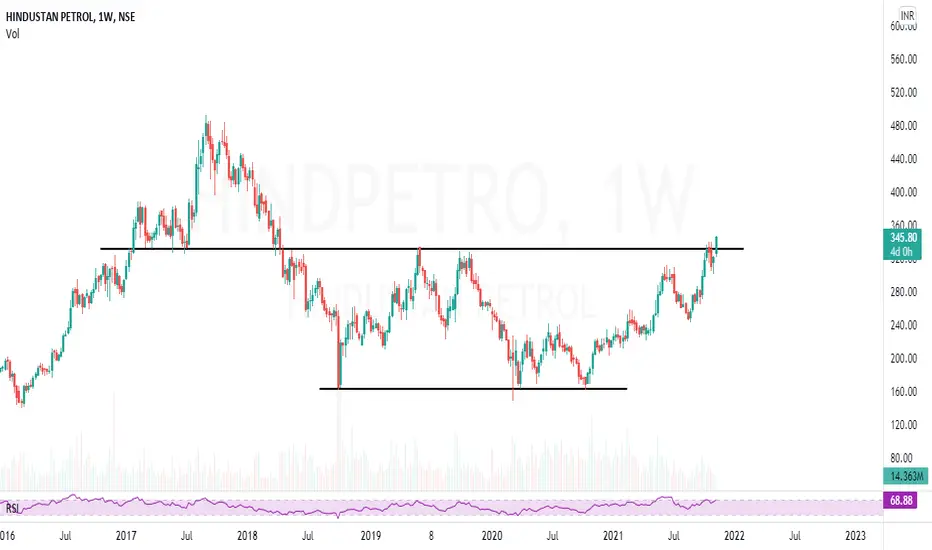
HPCLbreakout given weekly chart
might give good upside move in future
not any recommendation thank you
HINDPETRO trade ideas

HINDPETRO SWINGIt breaks a multi year resistance zone 332-339, with a 7.5% big bullish candle along with high volume .
A good swing for short to mid term period.
Buy price : 340-350
Stop Loss : 321
with a minimum target of 388.
55 EMA crossed 200 EMA on weekly chart which is also a good sign
Disclaimer : This analysis/strategy is only for educational purpose and not be considered as any trading idea/tip. Please consult your financial advisor before you take any trade and we are no way responsible for your profits/losses. Thank you!

HPCL breakout on daily chartHPCL given breakout on daily chart and also on weekly chart from 3year highs of 336
Buy at current 345-350 for the target of 360/390
with stoploss of 433.
Disclaimer: do your own research before investing trading on your own risk.

HINDPETRO | Promising consolidation - Looks good for 50%HINDPETRO | Promising consolidation - Looks good for 50% - Big move above 232 zone.
Making of W pattern
Consolidating in Flag
CMP : 220
SL : 200 (Just for this position)
Target : 330
1:5 risk reward setup

HINDPETRO | Simple trendline support with confirmation - 20%HINDPETRO | Simple trendline support with confirmation - 20%
CMP : 273
SL : 253
Target : 325, 345
1:4+ risk reward setup

HINDPETRO | INHS breakout - Potentially 10%HINDPETRO | INHS breakout - Potentially 10%
CMP : 281
SL : 272
Target : 310
1:3+ risk reward setup

HINDPETRO | Getting ready for another 40-45% moveHINDPETRO | Getting ready for another 40-45% move
CMP : 345 (Dip : 330)
SL : 290
Target : 445, 490
Almost 1:4 risk reward setup for 1st target.
Take a look at our previous trades in HINDPETRO (Link attached in related idea's)
HIND PETRO #HPCLClose above 340, will bring more upside as the resistance of 340 is being hit again and again

HindPetro probable long entry set up.....Idea as per mentioned on chart. tested 200 EMA twice with higher high.....reversal candle at last bottom(probably).....Keep in mind the time Frame......
PS : Just a reading sharing here......no trade idea/recc.....Personally may be holding position.....


Hindustan Petro good to go There is a good breakout and retrace on Hindustan Petro on daily and weekly chart cmp Rs 321 with a Stop loss 300 , Target 480
Holding Period 6 to 9 months
Please do your own analysis before take a trade

HINDPETROHINDPETRO . Bull Trend Started so i am Expected more bullish movement.(Buy =314) (Stop Loss =299) (Multiple Target= (333, 355, 369, 388.)

Hindpetro Double Top Short SnipeLevels mentioned on chart
Short triggered due to double top pattern formations

[ POSITIONAL ] HINDPETRO Long Betr : R ratio is 1 : 2
Rest as per Charts
Note -
One of the best forms of Price Action is to not try to predict at all. Instead of that, ACT on the price. So, this chart tells at "where" to act in "what direction. Unless it triggers, like, let's say the candle doesn't break the level which says "Buy if it breaks", You should not buy at all.
=======
I use shorthands for my trades.
"Positional" - means You can carry these positions and I do not see sharp volatility ahead. (I tally upcoming events and many small kinds of stuff to my own tiny capacity.)
"Intraday" -means You must close this position at any cost by the end of the day.
"Theta" , "Bounce" , "3BB" or "Entropy" - My own systems.
=======
I won't personally follow any rules. If I "think" (It is never gut feel. It is always some reason.) the trade is wrong, I may take reverse trade. I may carry forward an intraday position. What is meant here - You shouldn't follow me because I may miss updating. You should follow the system I share.
=======
Like -
Always follow a stop loss.
In the case of Intraday trades, it is mostly the "Day's High".
In the case of Positional trades, it is mostly the previous swings.
I do not use Stop Loss most of the time. But I manage my risk with options as I do most of the trades using derivatives.
=======

Swing Trade in Hindpetro!!Hindpetro has broke out from an inverted head and shoulder pattern (weekly chart) in which it had been consolidating for years. and the stock is retesting the upper trend line for going ahead and this would be the sniper entry point for positional traders. and I would suggest to enter after a strongly bullish weekly candle and can expect a gain of 8 to 14% returns in the coming month or couple. Never enter without the confirmation candle and keep your risk reward ratio high. Happy Trading!!

Hind petro - bullish trade ideaHindustan petro
Tech analysis -
Stock gave a breakout from inverse head & shoulder pattern on a big chart, which clearly indicates a long term trend reversal.
Stock price is doing a retracement post breakout, which presents a good buying opportunity.
Stock has good dividend yield, so if market goes down that we can hold it patiently.
Trade set up -
Go long at cmp and add more on dips. Keep a target of 400+ and we will revisit this trade above 400.
I cant see any need of stop less at the moment, we will revisit it if shoulder neckline breaks.
All the best.

Targed done 2X in hind petro new rally to begin 2X Target done in Hind petroleum after forming inverted head & shoulder pattern I decided for the target of 12 % but it crossed the target like rocket and given 21% return till now and never touched it down again. now it has passed the retest from target line for more bigger targets and now trading around 52 week high. Enter with small SL after breaking the 340 level along with huge volume. SL will be 329 for less risky traders or you can enter with SL of 313 for at least 1:2 Risk Reward.

HINDUSTANPETRO LOOKS GOOD 4yr resistance breakout nearlyit looks good above 340 T1360 T2 380 T3 400 SK 299 -DKM SIR
i think it cat go below 300 level
buy as per your risk

HINDPETRO LOOKS GOOD BUY 333-335T1355 T2 370 SL 299 -DKM SIR
i can see the breakout from here buy and hold as per your risk
i think stock cant go below 300 level

HINDPETRO LOOKS GOOD BUY 333-335 T1360 T2 375 SL 315-DKM SIR
Buy these level .....
i am not expecting stock go below 300 level


#Hindpetro long term opportunity#Hindpetro long term opportunity
Buy on dip for good RR
Target: 452
SL-243
CMP:331@17 October 2021
Timeframe - 3-6 Months

HPCL - Inverse Head & ShouldersInverse Head & Shoulders pattern forming on 3H Chart of HPCL. BUY CMP/280-281, SL/Support - 265, 260, 255, 250, 245 Target(s) - 290, 300, 310, above 312 -> 325-27. I'm learning chart patterns as of now. You can plan your trades accordingly if you know how to trade these patterns.
