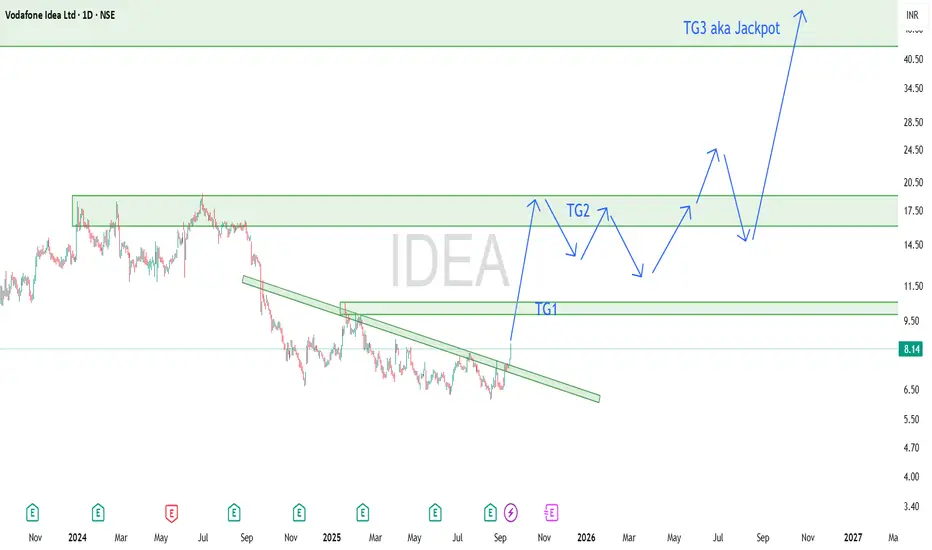
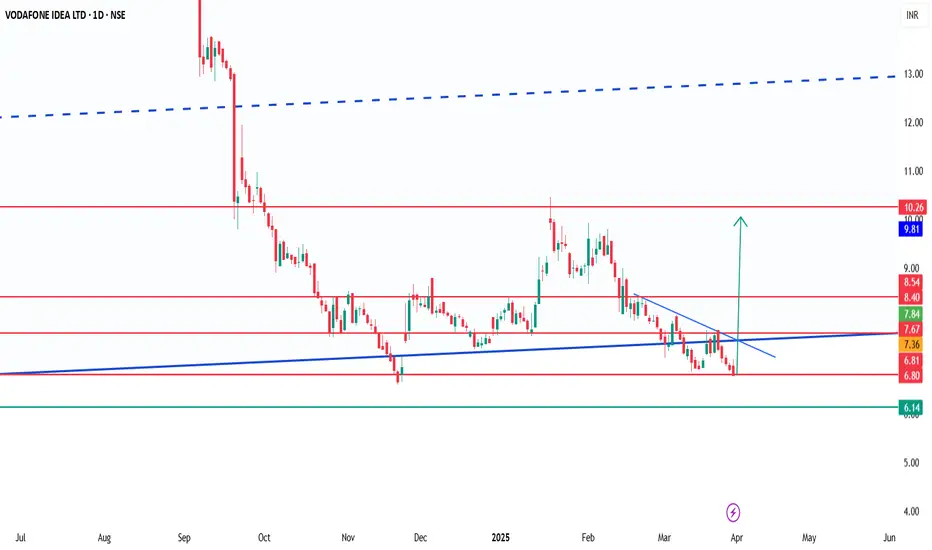
How to make Vodafone Idea a multibagger by 2026-2027After consolidating heavily at the bottom IDEA is finally moving up, We can plan for a long term view for insane profits, it will take months though. If your view is short just keep looking for bullish inside candle after a retracement and enter or Look out for good options CE setups in intraday for the next year or so, You can ride using 20 and 50 SMAs.
I'm gambling on the path(shown in arrows) it might take to reach jackpot, Remember holding that long will be a BUMPY ride, there might be deep retracements, expert traders will add more on those, Noobs will end up panicking and sell on the low of retracements and regret later. We also might see a couple of months long consolidations. If you are happy with the TG1, TG2 gains, you can book early and enter again when a good bullish setup forms.
OR this plan will fail miserably but its worth trying ;)
Entry at CMP or around 7
SL at 5.95
Targets 10, 18, 40 and beyond..
IDEA trade ideas
VodafoneIDEA (Opportunity during consolidation)Hi everyone
Welcome to intelligent investor, we provide market insights by synchronising and combining all the price action waves from different time frames and gives you single trend.
Degree Information

vodafone idea , crucial zonea rising wedge is forming in vodafone idea .
a crucial support is approaching and expect a breakout very soon in this stock.
keep an eye on vodafone idea , buy the equity at a recommended price of 6.10.\
expect a target of rs15 very soon in the coming months.

Stock name idea, short callViews are personal, idea should not hold current levels we can see long unwinding in idea very soon in this expiry. The result are very weak no positive trigger for the stock technically stock is very weak I personally am short on idea for 1.78 Million shares. Expecting stock to move towards 6.1-6.25 in next 2-4 days I won’t be shocked if stock slip towards 5.5-5.75. Let’s wait and watch
If someone wants to short then 6.75 - 7 is perfect zone. Returns and subject to market risk. Do your personal analysis then only make any decisions. P&L is subjected to your own risk. ( only for educational purposes)
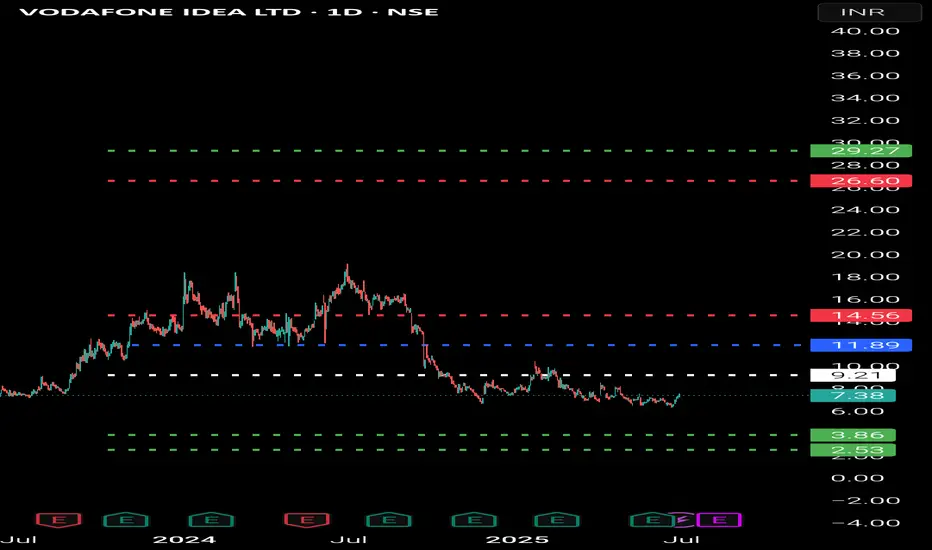
Vodafone Idea (VI) chart pattern analysis + fundamentals + peer Vodafone Idea (VI) chart pattern analysis + fundamentals + peer comparison + learnings
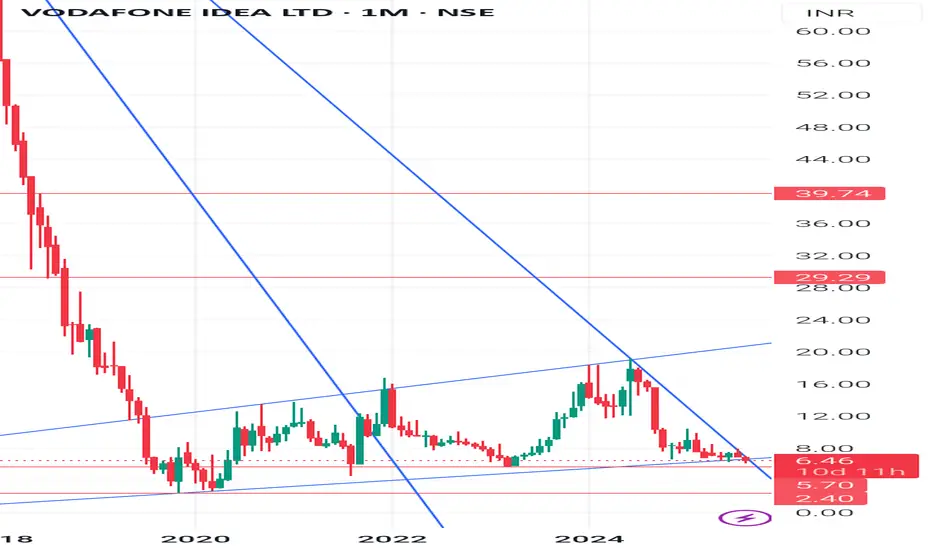
-Technical Chart Analysis – Vodafone Idea (Weekly)
-CMP (Current Market Price): 6.46 (+5.04%)
-Trend: Stock has been in a long-term downtrend since 2018.
👉Key Support Levels:
5.70 (immediate)
4.20 (medium-term)
2.40 (long-term bottom)
👉Resistance Levels:
8.50 (immediate)
12.20 (medium-term)
16.80, then 29.3 & 39.7 (long-term hurdles)
👉Pattern Observation:
Price is struggling near a channel support line.
Stock is in a make-or-break zone – either bounces back from current support or risks sliding further.
Any weekly close above 8.5 will confirm strength and may lead to 12–16 zone.
👉 Fundamental Comparison (Vodafone Idea vs Competitors)
(FY24 / recent data approx)
Company Revenue ( Cr) Net Profit Debt ( Cr) Market Share (Telecom) P/E Ratio ARPU (Avg Revenue/User)
Vodafone Idea - 42,000 Loss (-29,000 Cr) - 2.1 lakh Cr - 19% NA (Loss-making) - 145
Bharti Airtel - 1.4 lakh Cr Profit (- 8,300 Cr) - 1.6 lakh Cr - 33% - 68x - 208
Reliance Jio - 98,000 Cr Profit (- 20,000 Cr) - 1.1 lakh Cr - 38% - 22x - 182
🔑 Key Observations:
-VI is the only loss-making player in top 3.
-Heavy debt (- 2.1 lakh Cr) makes survival tough without tariff hikes or govt. relief.
-ARPU (revenue per customer) is lowest among peers, which shows weak monetization.
-Airtel & Jio are fundamentally stronger with consistent profits.
👉 Basic Learnings for Students / New Investors
1. Chart Patterns Reflect History – A stock in downtrend for years (like VI) shows structural weakness; don’t catch falling knives without reason.
2. Support & Resistance Levels – Help in risk management; always watch where the stock can bounce or fall.
3. Debt is a Red Flag – Too much borrowing restricts growth; fundamentals matter more than temporary price spikes.
4. Compare with Competitors – If peers are profitable (Airtel, Jio) and one is struggling (VI), investors must be cautious.
5. Turnaround Bets are Risky – Such stocks may give multi-bagger returns if revived, or wipe out wealth if debt crushes survival.
Disclaimer👉
This analysis is for educational purposes only. It is not financial advice or stock recommendation. Always consult a SEBI-registered advisor before investing. Market investments carry risk.
#VodafoneIdea #StockMarketIndia #TechnicalAnalysis #FundamentalAnalysis #Airtel #RelianceJio #TelecomSector #StockMarketForBeginners #InvestmentLearning #SupportResistance #ChartAnalysis
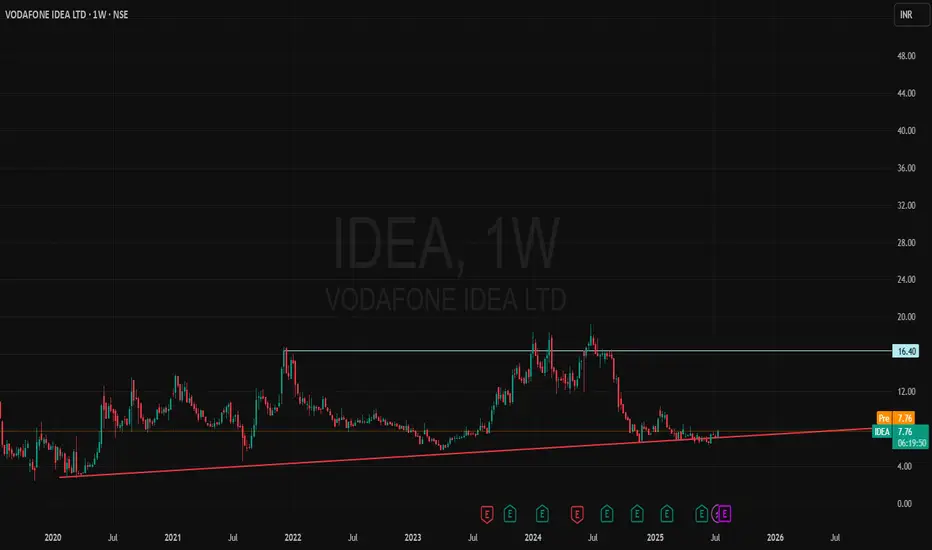
"Together for Tomorrow"📌 Vodafone Idea Ltd – Chart at Crucial Support Zone
🔍 Stock has successfully respected long-term support near ₹6.10–7.40 multiple times since 2021.
✅ Recent bounce backed by strong volume and improving technical structure.
✅ Gradual accumulation visible since past few weeks.
✅ RSI and price action both attempting to hold higher lows.
✅ OBV and momentum indicators hinting at early signs of recovery.
✅ Price trading inside a broad ascending triangle pattern since 2020 – potential breakout above ₹9 could confirm long-term trend reversal.
🧠 Risk-Reward looks favourable for long-term positional investors from current levels, with strict SL near ₹6.10.
🎯 Ideal for positional traders & long-term investors with a medium-term view.
📝 Note: Please do your own due diligence. This is not a recommendation, just a view based on charts and fundamentals.
🧠 Disclaimer: For educational and research purposes only. No buy/sell advice.
📝 Chart Purpose & Disclaimer:
This chart is shared purely for educational and personal tracking purposes. I use this space to record my views and improve decision-making over time.
Investment Style:
All stocks posted are for long-term investment or minimum positional trades only. No intraday or speculative trades are intended.
⚠️ Disclaimer:
I am not a SEBI registered advisor. These are not buy/sell recommendations. Please consult a qualified financial advisor before taking any investment decision. I do not take responsibility for any profit or loss incurred based on this content.
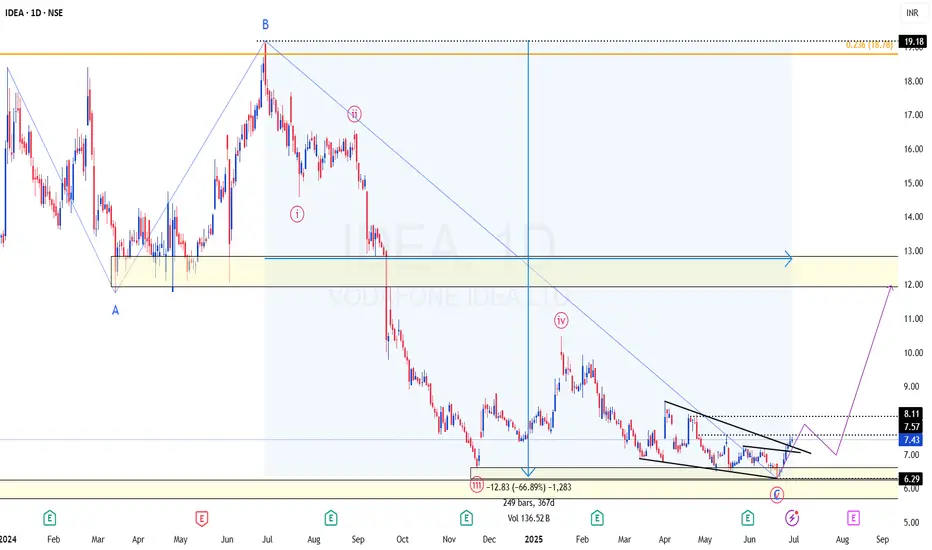
Is it a good IDEA to buy IDEA at this level?On 28th Jun 2024, price made 52 Week High at 19+.. Fast forward, one year later (30th June 2025) price is at 7.4 (and we hit the bottom end at 6.3 earlier in June). Can we expect the price to move towards the upper end again by June 2026? Past data will give us the clue
With the Ending Diagonal formation at the lows, some major counts are getting completed and the price is due for a bounce/reversal
Price Action:
On Weekly TF, Price is at the demand zone and gave a strong reversal indication.
On Daily TF, the recent Developments on the Volume front is encouraging
Price managed to close well above 7.2 and is eying to take out 8.56. The confirmation for the long set up will be activated only upon breaking the recent swing high at 10.47. But with the buying momentum seen on this counter, it should break the shackles and move strongly towards the upper end/range.
We have a FVG left at 12 and that could very well be tested sooner or later
Obstacles/Challenges:
200 DEMA is at 8.1 and could act as a resistance for the short term
Price had a one way up move from 6.3 to 7.55 and is due for a pullback/retracement (Overbought on shorter TF).
My Take: Any pullback to 6.5-6.75 could be a great deal to buy with a decent RR. A breakout above 7.55 (possibly 8.7) and then a pullback towards 6.5 is the best preferred set-up
Disclaimer: I am not a SEBI registered Analyst and this is not a trading advise. Views are personal and for educational purpose only. Please consult your Financial Advisor for any investment decisions. Please consider my views only to get a different perspective (FOR or AGAINST your views). Please don't trade FNO based on my views. If you like my analysis and learnt something from it, please give a BOOST. Feel free to express your thoughts and questions in the comments section.
IDEA (Vodafone Idea Ltd)- Analysis Bullish Levels -if sustain above 12 (early entry risky) then 15 (safe entry if sustain above this for a week) target can be around 26 to 29 first target, then last stop would be around 43 to 46
Bearish levels :- if sustain below 9 then swing trade exit below this if sustains for 2-3 days then 3.8 good support with SL of 2 for long term investors
**Consider some Points buffer in above levels
**Disclaimer -
I am not a SEBI registered analyst or advisor. I does not represent or endorse the accuracy or reliability of any information, conversation, or content. Stock trading is inherently risky and the users agree to assume complete and full responsibility for the outcomes of all trading decisions that they make, including but not limited to loss of capital. None of these communications should be construed as an offer to buy or sell securities, nor advice to do so. The users understands and acknowledges that there is a very high risk involved in trading securities. By using this information, the user agrees that use of this information is entirely at their own risk.
Thank you.
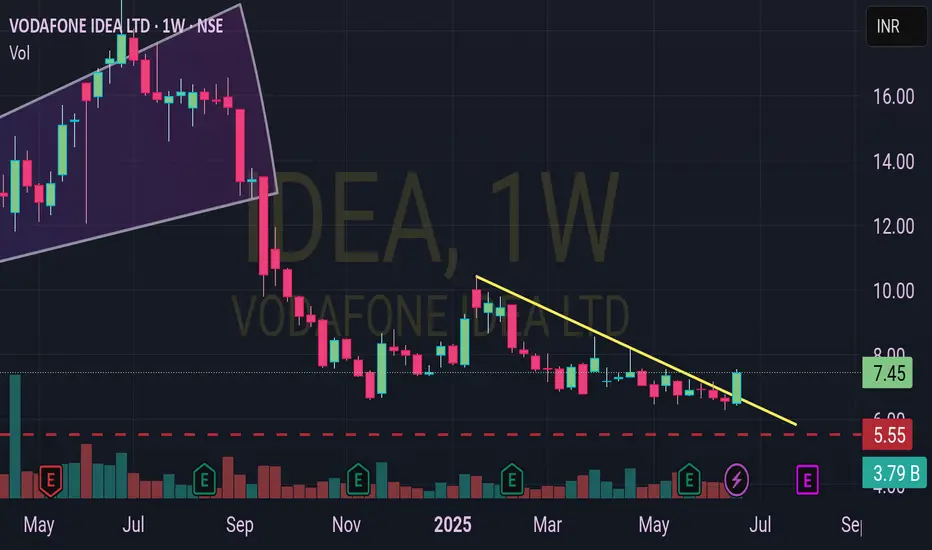
IDEA can be the best idea
🌟 Vodafone Idea Ltd (IDEA) could be a golden opportunity for traders! 📈
🔍 The weekly chart reveals a stock at a discounted rate, fueled by India's market growth.
💡 Even if business struggles, industry giants may step in to lift it—strong long-term potential!
📊 A descending trendline and recent uptick at ₹7.50 (+3.59%) hint at a possible reversal.
🚀 Strong conviction for a bullish future, though risks remain—conviction can falter!
🧠 Validate your belief, analyze fundamentals, and enter with confidence.
🎯 Current price at ₹7.50 vs. resistance near ₹16.00 suggests room to grow!
💪 Big players and market trends could drive this turnaround—don’t miss out!
🍀 Good luck, traders—make your move wisely!
#StockMarket #Trading #IDEA #VodafoneIdea #Investing #IndiaStocks #TechnicalAnalysis #MarketTrends #StockTrading #LongTermInvestment
Disclaimer: Grok is not a financial adviser; please consult one. Don't share information that can identify you.
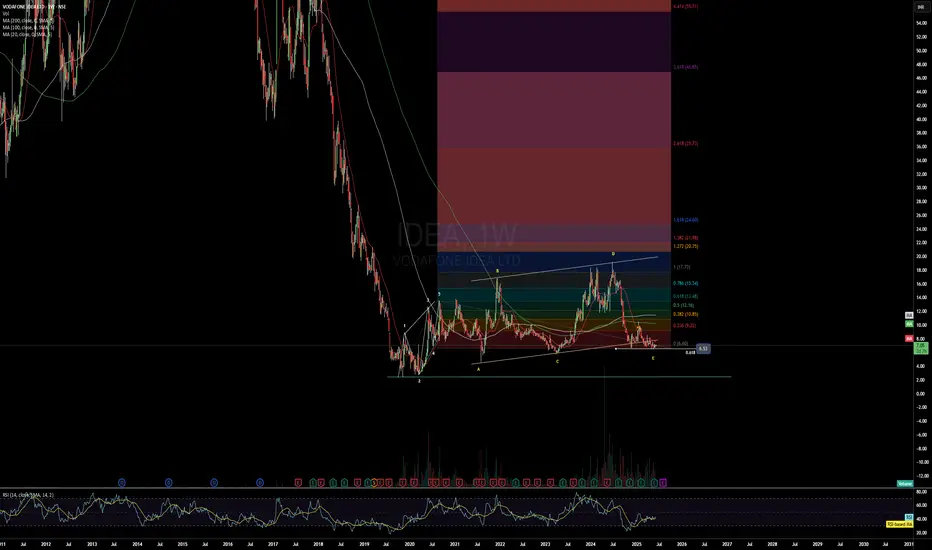
Vodafone Idea - Finally looks like correction is overI had earlier published my analysis on Idea multiple time and all went wrong as itformed complex corrective pattern.
I found a leading diagonal and so was expecting a good impulse move as the 3rd wave (marked in chart).
But as usual market has its own ways to tell you that you have still a lot to learn, and this one seems to have had a mind of its own and formed an expanding triangle for wave 2 (normally its not seen for wave 2).
However what i observe now is that the said complex correction -corrected to 0.618 levels which means an ideal level for wave 2, and the correction is complete with the E wave breaking the AC line.
So probably there is a fair chance to see the impulse move of wave 3 sometime soon.
Now that the govt ownership is at 49%, if the company goes bankrupt the government is going to be the biggest loser and they will end up writing off not just the fines and penalties but also the pending dues.
Keeping my fingers crossed here.
IDEA : At End of Bearish trend ; Expect correction or Bullish Idea showing 5 waves falling from Rs19 - 6Rs ; if price undergo for a correction expect minimum Rally 11Rs( i.e 38.2%) ,and maximum 15Rs.

Vodafone Idea – Key Levels & Market Outlook📌 Vodafone Idea (NSE: VODAFONE) – Key Levels & Market Outlook
Vodafone Idea (VODAIDEA) is currently trading near a strong support level at ₹6.80. If this level holds, the stock could see a potential breakout once it crosses the ₹7-₹8 resistance zone, paving the way for an upside move toward ₹10. However, a breakdown below ₹6.80 may lead to further weakness.
🔍 Technical Indicators:
📊 Bollinger Bands: The stock is near the lower band, indicating a potential bounce if buying momentum picks up. A breakout above ₹8 could confirm strength.
📈 ADX (Average Directional Index): Currently around 20, suggesting a weak trend; a rise above 25 would confirm bullish strength.
📉 Stochastic Oscillator: Hovering near the oversold zone (below 25), signaling a possible reversal if demand increases.
📊 Volume & Open Interest: Rising volume on up-moves and increasing delivery percentage could confirm accumulation by investors.
📌 Key Levels to Watch:
✅ Support Level: ₹6.80
📍 Resistance Zone: ₹7.00-₹8.00
🚀 Upside Target: ₹10.00
⚠ Breakdown Risk: Below ₹6.80 could lead to a slide toward ₹6.50 or lower.
A decisive move above ₹8 could trigger fresh buying, pushing prices toward ₹10. However, failure to hold ₹6.80 might invite selling pressure. Keep an eye on market sentiment, telecom sector updates, and volume trends for confirmation.
What does Idea Vodafone's chart say?What does Idea Vodafone's chart say?
As of September 2024, Vodafone Idea's total debt stood at approximately ₹2.16 trillion. This includes deferred spectrum payment obligations owed to the government. citeturn0search4
In December 2024, Vodafone Group settled outstanding debts of around ₹11,650 crore (approximately £1.09 billion) that were secured against its shares in Vodafone Idea. This repayment led to the release of 15.72 billion pledged shares, maintaining Vodafone Group's 22.56% stake in the company. citeturn0search0
To address its financial challenges, Vodafone Idea announced plans in December 2024 to raise up to ₹1,980 crore through the issuance of preferential shares to entities including Omega Telecom Holdings and Usha Martin Telematics. This capital infusion aims to alleviate some of the company's substantial debt, particularly obligations to network infrastructure providers like Indus Towers. citeturn0search4
Despite these efforts, Vodafone Idea continues to face significant financial hurdles. In February 2025, India's Supreme Court rejected telecom companies' appeals to recalculate their dues to the government, impacting Vodafone Idea's financial obligations. citeturn0news9
Additionally, Vodafone Idea's debt-to-EBITDA ratio remains high, indicating ongoing financial strain. citeturn0search7
The company is actively seeking solutions, including discussions with the government and exploring further fundraising initiatives, to manage its debt and support operations. In September 2024, Vodafone Idea concluded a $3.6 billion deal with network equipment suppliers to expand its 4G coverage and introduce 5G services, marking a significant step in its capital expenditure plan aimed at improving service offerings and revenue generation. citeturn0news13
navlistRecent Developments Affecting Vodafone Idea's Financial Positionturn0news9,turn0news10,turn0news13

Bullish view From Here In VodafoneVodafone Group Plc is a British multinational telecommunications company headquartered in Newbury, Berkshire, England. Established in 1984 as Racal Telecom Ltd, it became Vodafone Group Plc in 1991. citeturn0search2
As of January 2025, Vodafone operates mobile and fixed networks in 15 countries and maintains partnerships with mobile networks in 46 additional countries. The company serves over 330 million customers, providing mobile services, fixed broadband to more than 28 million customers, and television services to over 22 million customers. Additionally, Vodafone connects more than 150 million devices through its Internet of Things (IoT) services and offers digital financial services to over 50 million people in Africa via platforms like M-PESA and VodaPay. citeturn0search1
In India, Vodafone merged with Idea Cellular in 2018 to form Vodafone Idea Limited, branded as Vi. This partnership between the Aditya Birla Group and Vodafone Group provides pan-India voice and data services across 2G, 3G, and 4G platforms, making it one of the country's leading telecom service providers. citeturn0search3
Vodafone is committed to fostering an inclusive workplace, valuing diversity across race, ethnicity, disability, age, sexual orientation, gender identity, belief, background, culture, or religion. The company also emphasizes sustainability, taking significant steps to reduce its environmental impact. citeturn0search0
Under the leadership of CEO Margherita Della Valle since April 2023, Vodafone has undergone significant restructuring. The company sold its operations in Italy and Spain, focusing on core markets like the UK and Germany. In the UK, Vodafone's merger with Three is set to create the largest mobile operator, serving 29 million customers, with plans for an £11 billion investment in a new 5G network. citeturn0news20
These strategic moves aim to streamline operations, enhance customer experience, and drive growth in an increasingly competitive telecommunications landscape.

Vodafone Idea Stock Future#vodaidea is up due to expected positive decision in budget session.
Any disappointment could lead the vodafone idea share price to fall till its support, while positive news can atleast help it till weekly resistance zone of 14 odd.
#learn_at_stoxsense #Learntradingwithsudhir #StockMarket #idea

Idea : Breakout @8.30 From Triangle Idea is breaking out of a triangle pattern.
Buy @ 9.1-9.2 stoploss 8.00 tgt1 11.00, tgt2 13.00 tgt3 16.5, tgt4 19.15, tgt5 22.00 and much higher
Put Stoploss on closing basis.
(In Trading Time it may go above/below stoploss But closing price is most important).
These are levels are generated on the basis on Fibonacci Series
NOTE : I am not SEBI registered advisor in capital market.
Disclaimer:- Please always do your own analysis or consult with your financial advisor before taking any kind of trades. Please understand Risk in trading before taking any trade with your financial consult. I am only sharing my knowledge it may be right or sometimes wrong so I am not liable for any loss.
Dear traders, If you like my work then do not forget to hit like and follow me, and guy's let me know what do you think about this idea in comment box, i would be love to reply all of you guy's.
Thank you.

Vodafone idea wrt Airtel - If Idea follows airtels pattern - WowWas checking the charts of Airtel and Idea. Airtel had a period of consolidation (wave 2) for 11 years from 2007 to 2018. Where as it seems the consolidation is at the tipping point for idea..
Marked with yellow ellipse in the airtel chart where idea is..
The million dollar question is will idea follow the pattern of airtel now...
Then seeing Idea at 50 in the next 4 to 5 years...

#IDEA's Potential Fibonacci Journey: Reversal to 3.618 LevelIDEA could potentially reverse from the 0.38 Fibonacci level and aim for an upward move towards the 2.618 Fibonacci level. Following this, it may retrace to the 1.618 Fibonacci level before making a final push towards the 3.618 Fibonacci level.

IDEA breakout for the daySupport and resistance are key concepts in technical analysis, widely used by traders and investors to identify price levels where an asset’s price tends to find stability or reverse direction. Understanding these levels can help make more informed decisions about entry and exit points. Here's a deeper dive into these concepts:
Support Levels:
Definition: Support is a price level at which an asset tends to find buying interest, preventing the price from falling further. It’s essentially a "floor" where demand is strong enough to stop a downward trend.
Significance: Once the price approaches a support level, buyers are typically more willing to step in, believing that the asset is undervalued at that point.
How to Identify:
Look for price areas where the asset has bounced up in the past.
Areas where the price has reversed or consolidated several times.
The more times a price has tested and bounced off a certain level, the stronger the support is considered.
Resistance Levels:
Definition: Resistance is a price level where selling pressure outweighs buying, creating a "ceiling" that prevents the asset from moving higher. When prices approach resistance, traders might sell or take profits.
Significance: If the price breaks through resistance, it could signal a new uptrend or buying opportunity.
How to Identify:
Look for price points where the asset has reversed or stalled in the past.
The more times the price tests a resistance level and fails to break through, the stronger that level is considered.

"Vodafone Idea: Potential Turnaround or Risky Swing Opportunity? "Vodafone Idea: Potential Turnaround or Risky Swing Opportunity?"
Stock: Vodafone Idea Ltd.
Analysis:
Vodafone Idea has faced significant challenges, with the stock currently down 58.34% from its 52-week high, reflecting its struggle in a competitive market. However, recent developments suggest the possibility of a turnaround for this stock, making it an interesting pick for high-risk, short-term investors.
Key Highlights:
Recent Developments:
Preferential Issue: Recently announced, which is expected to help the company stabilize its finances.
Government Support: Positive policy news for the telecom sector could provide a much-needed boost.
Technical Setup:
Volume Activity: High volume seen recently, indicating renewed interest.
Moving Averages: Convergence of key moving averages suggests a potential reversal.
Institutional Support:
FII Stake: Gradual increase in FIIs' holdings reflects cautious optimism.
Financials:
While the company is still loss-making, financial metrics show signs of improvement, supported by external measures.
Trade Plan:
CMP: ₹8.
Target: ₹11 (short-term swing).
Risk: High. This stock remains speculative, suitable for those with a high-risk appetite.
Stop Loss: ₹6.5 for risk management.
Disclaimer:
This analysis is for educational purposes only and is not financial advice. The stock is speculative and comes with high risks. Please conduct your own research or consult a financial advisor before making any investment decisions.

IDEA: What is your idea sirji?As we all know and seen about the rise and fall of Idea stock due to AGR Dues and all other reason.
Let me know your opinion about should we again hop back on idea for next set of rally or idea is going to lose all its gloery this time.
IMO we have to wait till we can see a close above 12 rs on monthly time frame.
It does not constitute and cannot replace investment advice. We therefore recommend that you contact your personal financial advisor before carrying out specific transactions and investments.

IDEA At Weekly SupportHello Everyone,
vodafone idea taken support of weekly trendline with rsi oversold zone closing abve 10 is good opportunity for bulls till resistancce 16,18,22

Idea - An idea may change your life7.50 - 60 new strong support area
9 - 9.10 Strong resistance area
Stock may stuck n reverse a little before turning around
Once close above 9.10 next stop only at 11 & 13.60
Trade accordingly
