IDEA trade ideas

IDEA LONGI hope you can now see how IDEA represents an excellent low risk profit entry setup allowing you to trade in the market.Take positions so that the risk/reward is in your favor.
Knowing why, where & when a strong reversal signal is being generated will be the only way to capitalize on your technical analysis .
Disclaimer: It should not be assumed that the methods, techniques, or indicators presented in these chart will be profitable or that they will not result in losses. There is no assurance that the strategies and methods presented will be successful for you. Past results are not necessarily indicative of future results. You should not trade with money that you cannot afford to lose. Examples presented in these charts are for educational purposes only and it should not be assumed that these are indicative of ordinary trades. These setups are not solicitations of any order to buy or sell. The publisher assume no responsibility for your trading results. There is a high degree of risk in trading.

EVERY DIP BUY IN IDEA 03.01.2022BUY : 14.50 TO 15
TAEGET : 20 TI 21.10
Reason For Buying This Script :
In this script it forming Elliott wave in weekly time frame. Try to buy at lower levels is has good potential to move further Don't miss this opportunity.
Note :
Above given levels are based on monthly & weekly time frame . So be patience it will take some days to achieve the target.
ALL THE BEST ..

Can IDEA give 3X Bagger from here?Can IDEA give 3X Bagger from here?
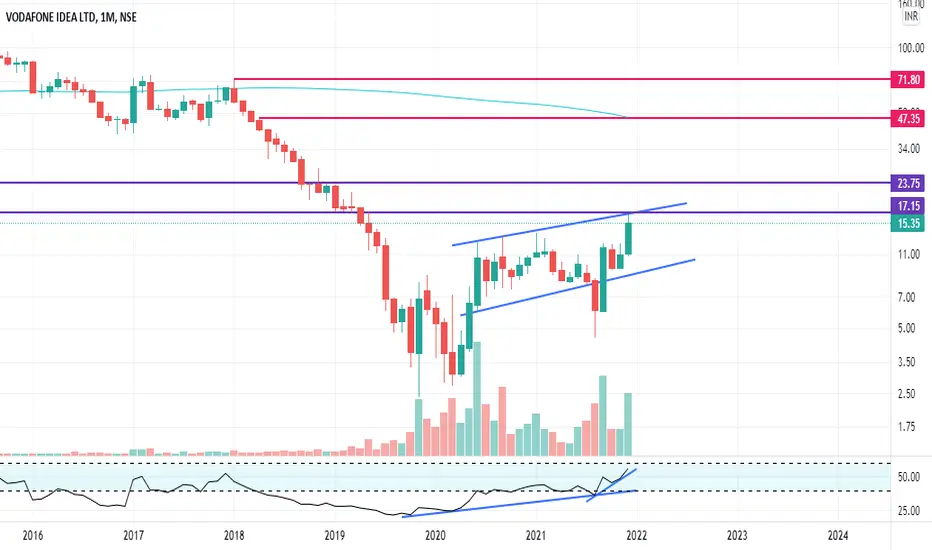
If you look at charts, IDEA is making HH-HL Pattern. If IDEA manages to break, sustain above and give monthly closing above 17.15, stock would enter the Resistance Zone of 18-24 and may stay there for some time before breaking out and reach our Targets of 47 and 72. As of now, views are negated below 8.5 MCB which would keep on changing as stock moves higher. This is obviously a risky bet but Risk to Reward Ration is very much favorable. But only invest a small portion of your total capital.
IDEA 1D TFIDEA after struggling for a long time as broken the resistance and is ready to move up.
CMP :- 15.35
SL :- 13
Target :- 21+
R:R :- 1:2.5
Disclaimer :- This is just my view. Please analyse charts yourself and then decide to initiate trades.


Hold Target 29 DaysVI chart showing strong strong hold to investors and swing traders...get ready for surprise

BUY VODAFONE IDEAMonthly close above the AVWAP will trigger a fresh buying interest in the stock.
1st target 26
2nd target 64
3rd target - will update post 2nd target

NSE:IDEA 6% bagged till now !!NSE:IDEA
#IDEA 14CE shared @ 0.8 reached 1.3 till now,
details shared !!

Vodafone Idea Daily ChartVodafone Daily Chart Analysis
Major support level
head and shoulders pattern

Vodafone Idea, breakout and pullback is providing an opportunityThe Base has finally formed in VI with the breakout from 13.80 levels...one can go long in this counter keeping SL of weekly closing below 13.80 for target of 25.. at present a pullback towards the inital BO level can also be observed which may be used to take positions...the smiley face says it all.. keep the stop loss level in mind


Inverted Head & Shoulder Chart Pattern - Vodafone Idea (Daily) Inverted Head & Shoulder Chart Pattern
Vodafone Idea ( Daily timeframe )
Target is 20.9 (i.e. depth of the head when placed on expected breakout point of 13.85 on the neckline of inverted head & shoulder)
It has entered the 5th wave ( Elliott Wave Count)
MACD is in positive crossover state above the zero line of the histogram
Histogram has solid green bar formations
RSI is above 60 and Stochastic (14,3,3) is in positive crossover state too
+DI is above the -DI in the Directional Movement Index (DMI)
ADX is well above 15 (indicating momentum speed)
On the weekly tide chart too, all indicators/oscillators are favourable


Chart of the week. Vodafone Idea. 11/12/21Last week Idea has given a breakout on its weekly chart. From last 2 years the stock was trading in range on its weekly chart , which can be seen by pink lines . Last week, however, the stock has given breakout of its important resistance @14. This week the stock has retested its previous resistance @ 14 and given breakout of its weekly range by high volume . This confirms the last weeks breakout and now this stock is ready for its up move. On medium to long term, the stock has entered in a bullish territory. With a deep SL one can enter in the stock with small amounts and add as stock hits new highs.
Target - 20, 30, 40 W.
SL - 12 W
View - Medium to Long term.

Positional BUY Trade | IDEA | LONG-TERMNSE:IDEA
One weekly time frame it gave breakout of 200 MA with increased volume.
200MA is placed at 15.11 level.
Any dip above 15 level will be good buying opportunity.
SL can be 13.45
Short term target can be 18.05
Mid Term Target can be 20
Long term target can be 23.40.
***************Please note this is my own study/opinion, it is not a trade recommendation**********************
Please Consult your financial advisor before making any investment.

Intraday opportunityLong at the levels of 16.10 or 15.95 or 15.80 stagger ur investment at the levels mentioned for tgt of 17.05.
Avoid trading if opens gap at 17.05.
Good luck

vodafone idea bullish sharkDo not worry as it has fallen from 12.30 as the stock has to follow the harmonic pattern and will eventually complete its upside journey and that lower red line as we can see has been supported for now and is stop loss on candle close basis. Target for long is still remaining at 13.10
good luck
Trade and invest at your own risk
Please like & share ideas if you find them useful as it takes much efforts to learn technical analysis and our 99% Harmonic pattern go well if you go through all previous ideas posted on tradingview


Long Idea - Inverted HnS formingTarget 13.85
SL 8.4
Good chance to enter
Discalimer - as you financial advisor before taking trade I am not responsible for you

IDEA broke out 52 Week Price LevelIdea Price just convincingly broke the 52 week price level on Falling Wegde Chart.
