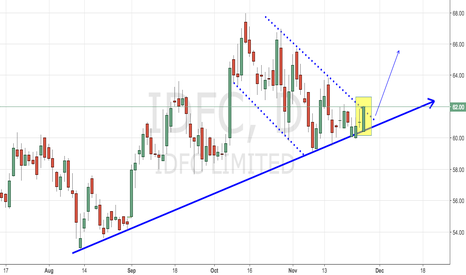
IDFC trade ideas
Intraday....Short on breaking support lineRetracement can form at the opening...therefore do not trade if green candles form..
long idfc for a target of 50% form hereprices are rejecting further downwards move, long are waiting and inviting some short to trap,buy with a stop loss of 50.70 for a target of around 30-50% form here.
IDFC LTD - Long - PositionalIDFC LTD closing on moving averages with good volume.
RSI - Positive
MACD - Crossver
Volume - Good
IDFC Bullish Wolfe wave Target 76+NSE:IDFC is in good demand zone. One can buy with for Target of 76 in 4 to 5 months holding with stop loss of 52
Buy Short & Medium Term14-01-18:
Buy 66-67
Short Term Target 71,
Medium Term Target 74, T2-82
Stop Loss 63 (Closing Basis)
Looking for a Breakout on triangle patternHere we r looking for triangle breakout pattern and we place 2 orders, need to cancle one trade when another got triigered .
Time frame: day
stop loss for buy 59
stop loss for sell 58
IDFC - Symmetric triangle formation NSE:IDFC has formed symmetric triangle one can go long on break out.
Go long above 63.80
T1 - 65.80
T2 - 67.90
Sl - 61.10
IDFC Ltd - Smaller breakout setting up for the bigger breakoutIDFC made a small triangle breakout today for tgt near 69 where it will get ready for a bigger C&H breakout eventually. Can be bought positional as investment for next 6 months and it could prove to be a doubler.
Double bottom formation in IDFCIDFC is on verge of a minor breakout from a double bottom formation. It can be bought now with a target above 67 (50% of W shape height) with a stop loss of 60 (below 0.618 fibonacci).
Buy IDFCBased on Fibonacci retracements and analysis, IDFC is bound to bounce to 59.5 levels in 5-6 trading days as it is trading at crucial confluence zones of past 2 retracements.
IDFC attempting Formation of 'W" PatternIDFC: @ 56.7 (1.55 PM, 13/06/2017)
Attempting Formation of 'W" Pattern.
Trading Strong Support at Fib. Retracement 0.382
Attempting to enter Ichimoku Cloud from Below.
All short term levels plotted in chart.
Swing levels:
RES: @ 57, @ 57.3, @ 57.8, @ 58.15, @ 58.45+
SUP: @ 56.2, @ 55.6, @ 55.3, @ 55.1-
More Updated Later.
PS: If you like Ideas/Analysis, please Like/Share & keep motivated.
IDFC - Can break consistencyStruck around pivot line, show similar consistency during mar and apr, 17.
If it breaks resistance/pivot level and show bullish trend
From current levels, New resistance TP=74, 80
SL could be 55


