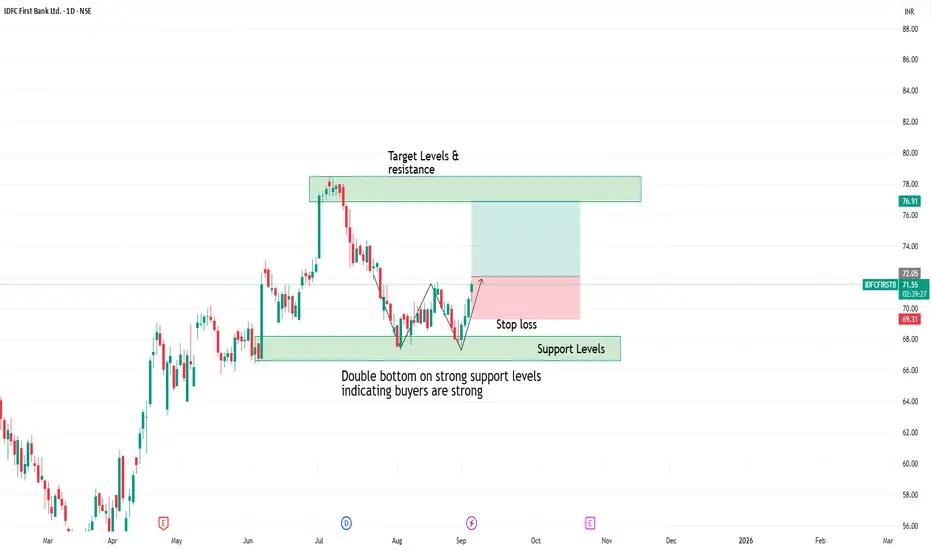
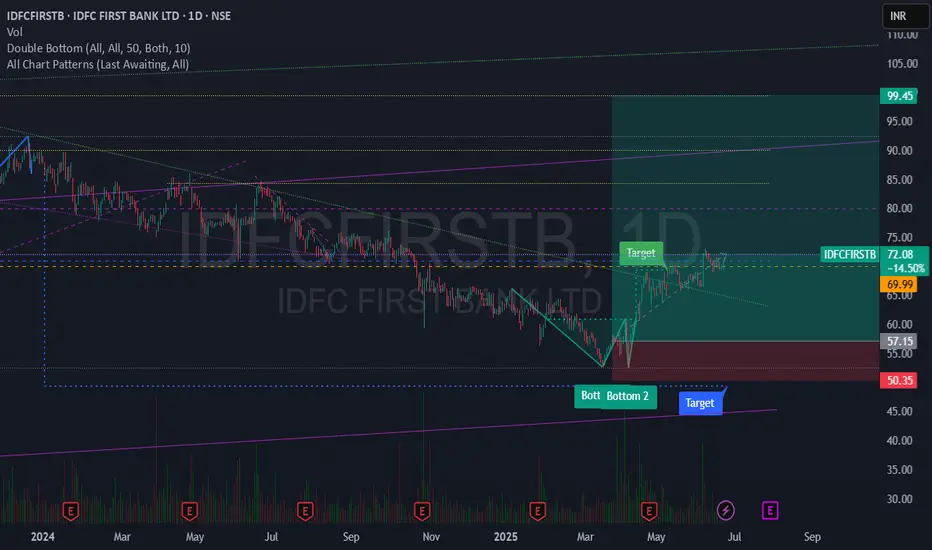
Double bottom created in idfc first bank Double bottom created on support levels
which indicates buyers are strong and accumulating at support levels
one can observe this for upside movement with strict stoploss
IDFCFIRSTB trade ideas
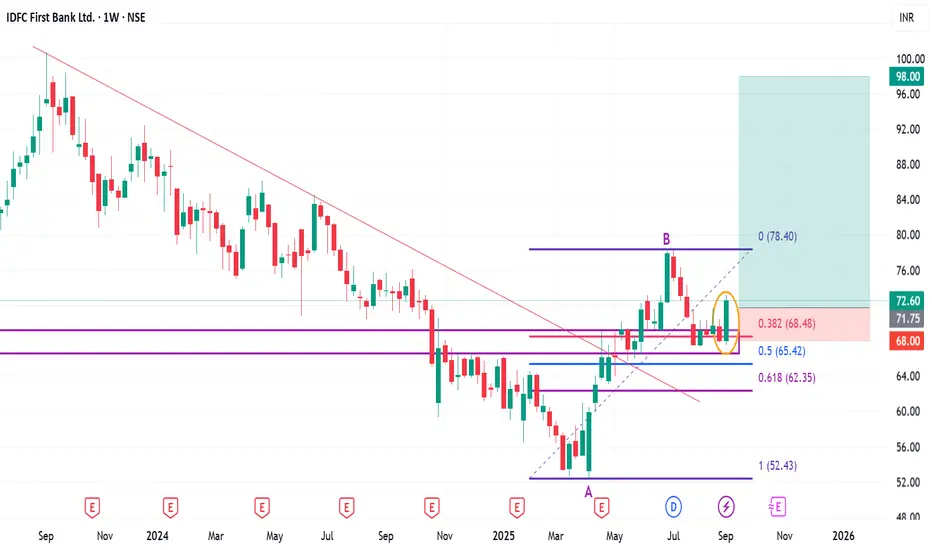
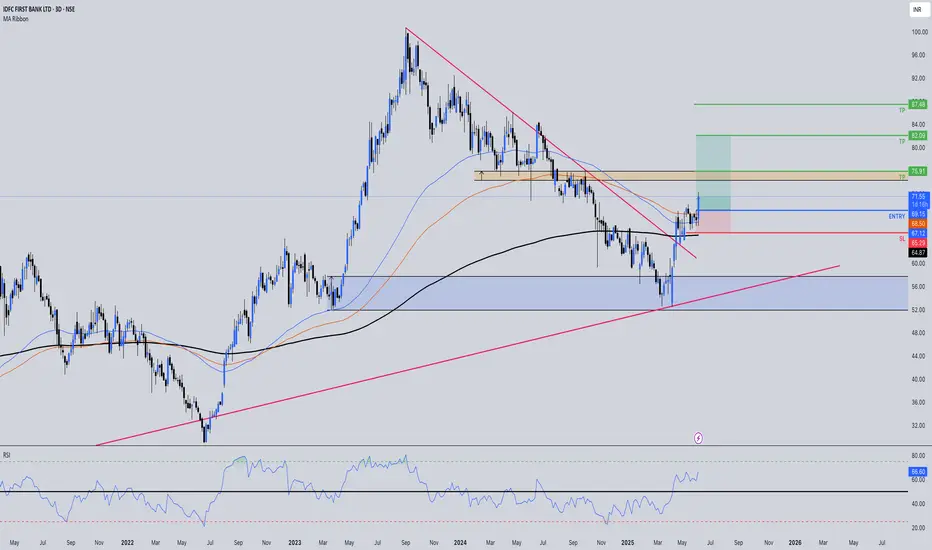
Positional or Long-term opportunity in IDFC First BankGo Long @ 71.75 for Targets of 82, 90.5, and 98 with SL 68
Reasons to go Long :
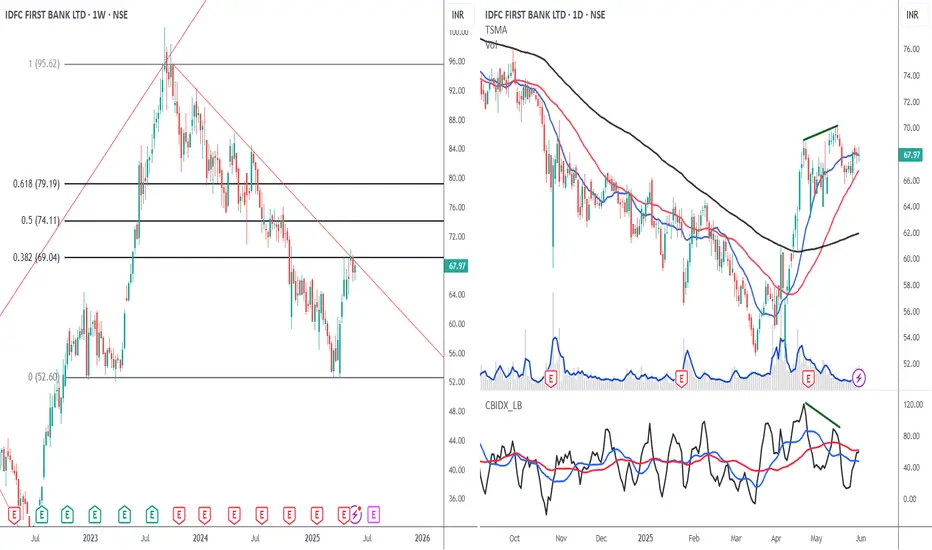
1. On Weekly timeframe If we draw Fibonacci retracement from the recent swing low (A) to the swing high (B) then the stock took support from the 0.382 Fibonacci level.
2. In addition to this, the stock formed a Bullish Engulfing Pattern (marked with a orange color) around 0.382 Fibonacci level.
3. Also there is a strong demand zone (marked with a purple color) from which the stock is taking support.
4. Besides the stock formed a Double Bottom (W) pattern at 0.382 Fibonacci level.
5. Also the stock gave a Trendline breakout (marked with a red color).
IDFCFIRSTB Price ActionIDFC First Bank is trading at ₹72.60 as of September 8, 2025, and maintains a solid presence in India’s private banking sector. The stock has a market capitalization near ₹53,264 crore, having seen an 8.7% gain over the last three months and a 25% rise over six months, while its year-on-year change is slightly negative. The share price is just below its 52-week high of ₹78.50, reflecting mild short-term consolidation after recent rallies.
Financially, IDFC First Bank continues to deliver growth: its annual operating revenue for FY25 approached ₹36,500 crore. Net interest margin remains strong at 5.6%, and the bank’s gross NPA ratio has declined to 1.87%, with net NPA at 0.53%, representing improved asset quality. Net profit for the previous year edged higher, and the latest quarter saw stable promoter holdings, a minor uptick in DII ownership, and balanced institutional participation.
The valuation remains elevated, with a price-to-earnings ratio of 40.78 and price-to-book near 1.4, as the market is factoring in future growth from retail advances, digital initiatives, and improving cost efficiencies. Technical indicators show the share trading above 50-day and 200-day averages, confirming ongoing bullish sentiment, and weekly stochastics point to strong price momentum. Dividend yield is modest but consistent, as the bank prioritizes growth and capital buffers.
Overall, IDFC First Bank offers a constructive outlook thanks to ongoing improvements in profitability, asset quality, and operational metrics. The bank is well-positioned for further gains if trends in retail lending, fee income, and digital channels remain favorable.
IDFC First Bank to make fresh lows?With intense pressure from the top, we may say a fresh low in IDFC First Bank. Currently looking to have completed its micro degree wave 4 in its downtrend
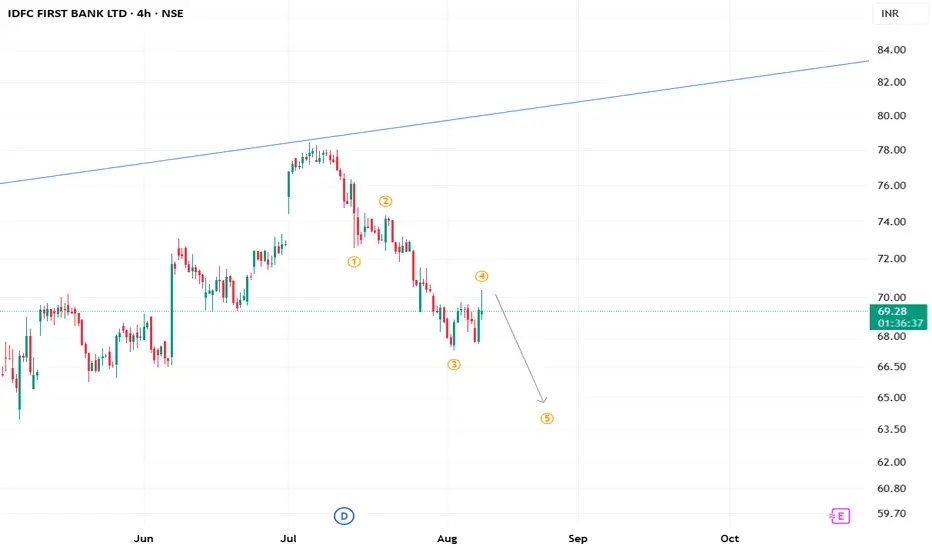
IDFCFIRSTB LONGThe Elliott Wave Structure is the Elliott Wave Theory's description of the structure and pattern of price movements in financial markets.
The Elliott Wave analysis shows that the stock has completed waves (i) and (ii), which appear as blue numbers on the daily chart. Wave (iii) appears to have five sub-waves.
The red color of wave (iii) indicates the completion of waves i, ii, iii, and iv, while wave v is still ongoing.
The black circle illustrates the estimated number of subdivisions in Wave v.
Wave 1 of wave v in the black circle is finished, and wave 2 is nearing completion.
It's a buying opportunity during a downturn (dip).
Following the completion of wave 2, wave 3 will be divided into five sub-waves.
The blue brackets indicate the sub-waves of Wave 3.
Wave levels are depicted on the chart.
Level of Invalidation
The invalidation level for Wave 1 is 75.05. Because According to wave rules, Wave 2 cannot retrace more than 100% of Wave 1. If the price falls below this level, it may signal that the projected Elliott Wave pattern is not what it appears.
I'm not a registered Sebi analyst. I conduct my research exclusively for academic purposes.
Please consult your financial advisor before trading or investing. I accept no responsibility for any profits or losses.
Regards, VJ.

IDFCFIRSTB LONGElliott Wave analysis shows that the stock has completed wave i in black circle. Currently, the stock is undergoing correction wave ii shown in black circle. wave (ii) will move in (a), (b), and (c) in a daily time frame in blue color.
Wave (a) in blue colour is completed and the stock is currently in wave (b).
Wave (b) will unfold in three sub-waves (a-b-c) shown in red colour on the chart.
Wave a and b (red colour) of wave (b) is completed and the stock is in wave c of wave (b).
Wave level is shown on the chart.
Level of Invalidation
The starting point of Wave c has been identified as the invalidation level at 62.40. If the price falls below this level, it can indicate that the expected Elliott Wave pattern is not as it seems.
I am not a registered Sebi analyst. My research is being done only for academic interests.
Please speak with your financial advisor before trading or making any investments. I take no responsibility whatsoever for your gains or losses.
Regards
Dr Vineet

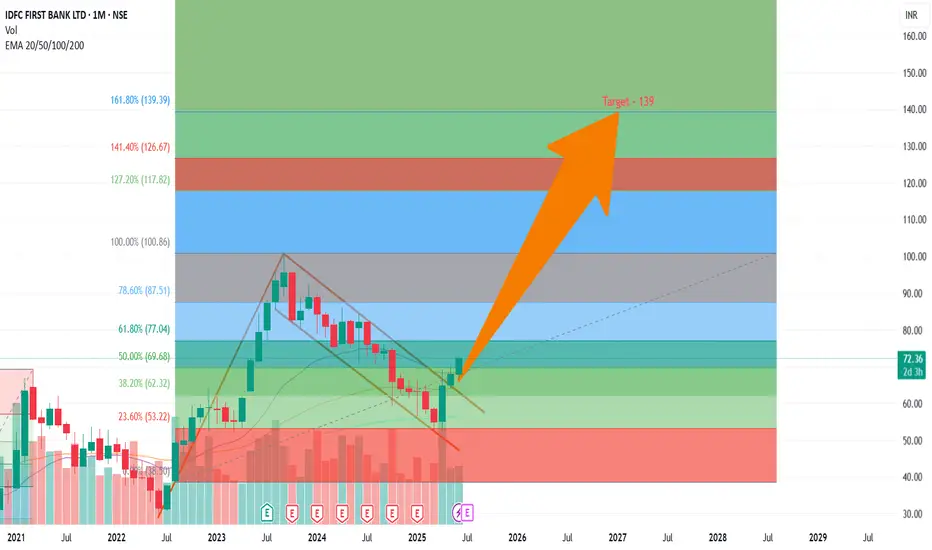
LONG IDFC FIRST BANK - Target - 139On Monthly chart IDFC first Bank has broken out from flag and Pole pattern.
Indicating a strong bullish Momentum.
Stop Loss is 61
Target 1 - 100
Target 2 - 110
Target 3 - 139
IDFC FIRST BANKIDFCFIRSTBANK.
Anything above 112 should be part of euphoria that may extend upto 164.17 (if sentiment allows); corrective 5th may end around 50-53 and then final thrust towards new high (5th) should begin. (If , moves past 80-83 without 5th correction , corrective wave count will be invalid).
Labelling of counts can be wrong in this, but you get the idea.

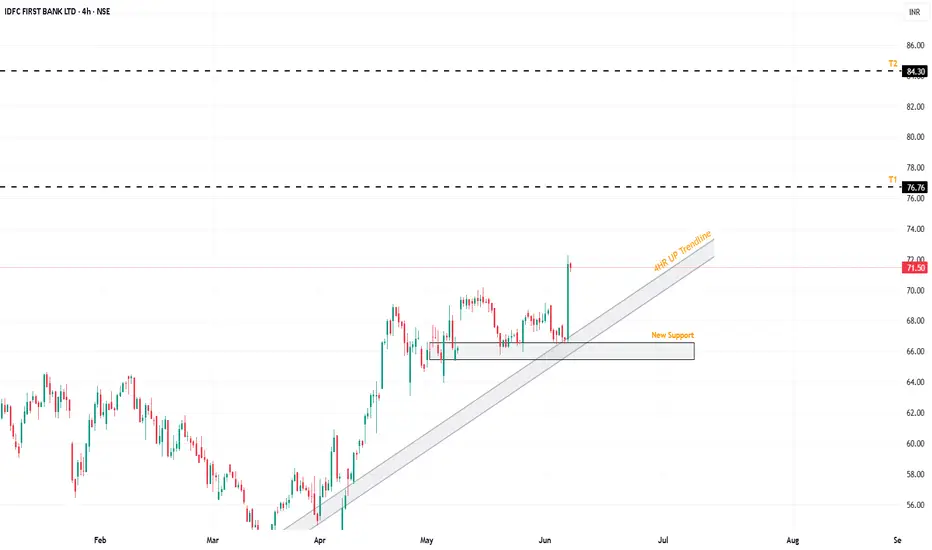
IDFC FIRST BANK | 4HR Idea – 10 Jun 2025 / SWING📌 IDFC FIRST BANK | 1D Idea – 7 Jun 2025
Bias: Bullish
CMP: ₹71.55
Market Structure
• Strong uptrend after breaking downtrend line; price respects 4H uptrend channel.
• Bullish breakout above recent consolidation; new support at ₹66–67 zone.
Levels
│ R1 ₹76.76 │ R2 ₹81.00
│ S1 ₹66.00 │ S2 ₹60.00
Trade Plan
🟢 Breakout Long → Entry on 1D close > ₹72.00
Targets ₹76.76 / ₹84.00 │ SL ₹66.50
🔴 Breakdown Short → Entry on 1D close < ₹65.80
Targets ₹62.00 / ₹60.00 │ SL ₹68.00
Notes
• Fresh momentum breakout above range; aligns with trendline confluence.
• Watch for volume confirmation above ₹72 to sustain rally.
Set alerts at ₹72.00 and ₹65.80; risk ≤ 1 % per trade.
#PriceAction #IDFCFIRSTBANK #1D
IDFC FIRST BANK: Reversal Play for 20% upside⚡️Price Analysis:
1️⃣ Price broke the resistance.
2️⃣ Price structure is bullish.
3️⃣ Price trading above EMAs
4️⃣ Strong candle formation.
✨ Key Observations:
➡️ RRR favorable at CMP.
➡️ Price should break the immediate marked resistance to build further strength & momentum.
➡️ Overall banking sector is strong.
⚠️ Disclaimer: This is NOT a buy/sell recommendation. This post is meant for learning purposes only. Views are personal. Please, do your due diligence before investing.⚠️
💬 Share your thoughts in the comments below! ✌️
🔥Trade Safe!✅🚀
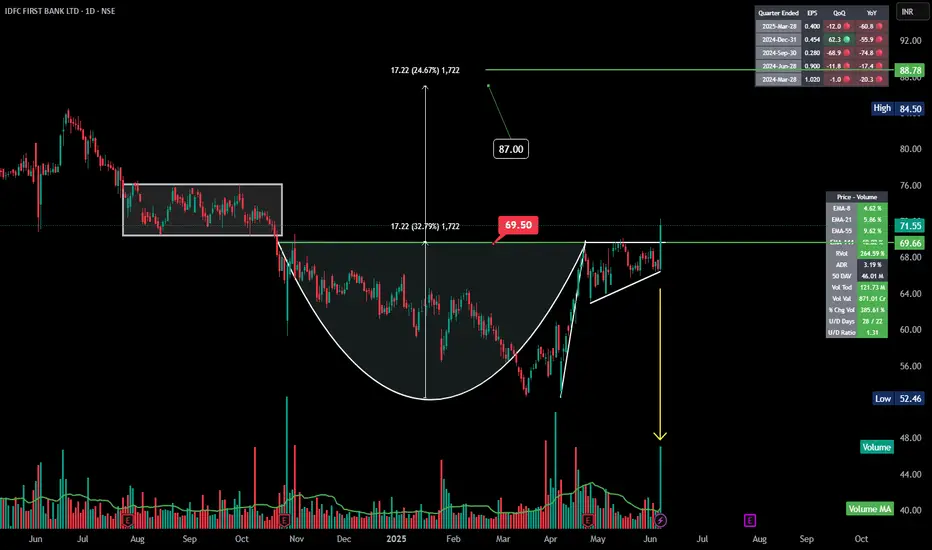
IDFCFIRSTB | Cup and Pattern | BreakOut | Huge Volume |Daily✅ Pattern: Cup and Handle breakout above 69.50 INR.
✅ Target: ~87 INR (based on cup depth projection).
✅ Breakout Confirmed: Strong volume surge.
✅ Support: 69.50 INR
✅ Momentum: All EMAs trending up, bullish.
✅ Action: Stay long above 69.50; target 87 INR.
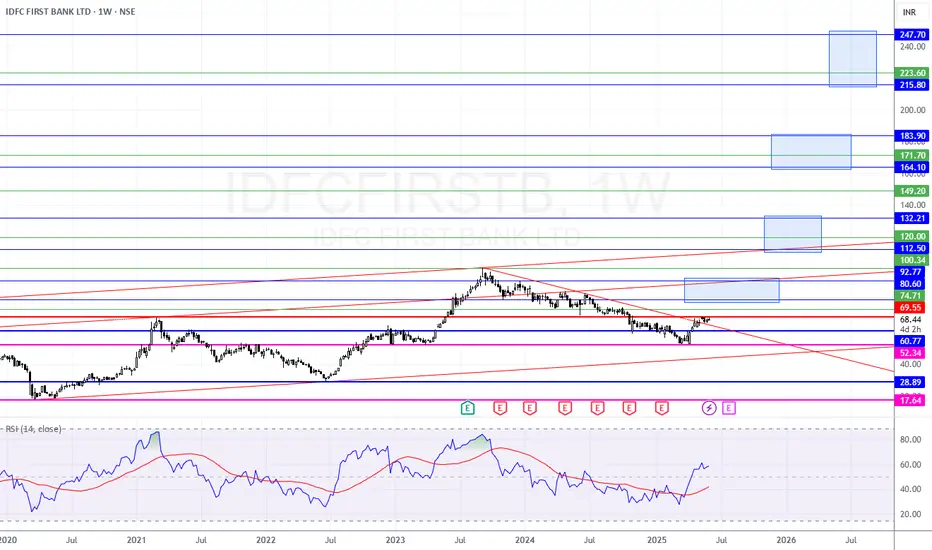
IDFC FIRST BANK LTD @ 68.45 - Long term Analysis on 02-Jun-2025Resistances: 84.55/100.70
Supports: 52.34/28.89/17.55
Immediate support: 60.77
As long as the above supports hold, we can see big bull run in IDFC First Bank.
Above 69.55, we will see 74 first.
Long Term Targets:
Min target: 80-92
100
Normal target: 112-120-132
149
Ultimate target 1: 164-171-183
Extension 1: 215-223-247
Ultimate target 2: 344
My View: Buy On Dips.
IDFC BANK LONG TERM VIEWPrice seen taking support from the key demand area of 52-58 zone
Points To Note
- EMA 10-20 Bullish Cross At Weekly TF
- Downward Trendline Breakout
- Price Is Consolidating After T-line Breakout
- Once It Gives Break Above 70.80 Then We Can See Further Upsides
Lets See What It Follows Next
Till Then , Keep Following Markets

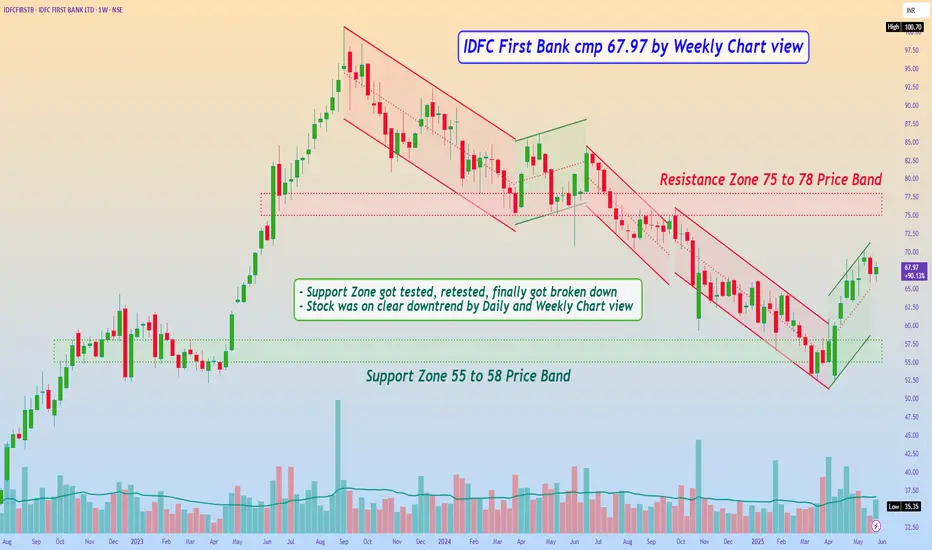
IDFC First Bank cmp 67.97 by Weekly Chart viewIDFC First Bank cmp 67.97 by Weekly Chart view
- Support Zone 55 to 58 Price Band
- Resistance Zone 75 to 78 Price Band
- Support Zone got tested, retested, finally got broken down
- Stock was on clear downtrend by Daily and Weekly Chart view
- Stock took support near old price level 50 to 52 to reverse upside
The rally is overIDFC Bank CMP 68
Fib - the retracement to 38.2% is weakness. Can it go higher??
Candlestick - Four small candlesticks in a row around the resistance is indicating reversal.
Trendline - this further cements the zone as a strong resistance.
RSI - the rally has brought the RSI to the bear zone. This is telling me the fall is not yet over.
Composite - the oscillator has given -ve divergence confirming the reversal.
Conclusion - the rally is over. And now the TIME has come for this counter to correct. My first tgt is back to the base at 52.
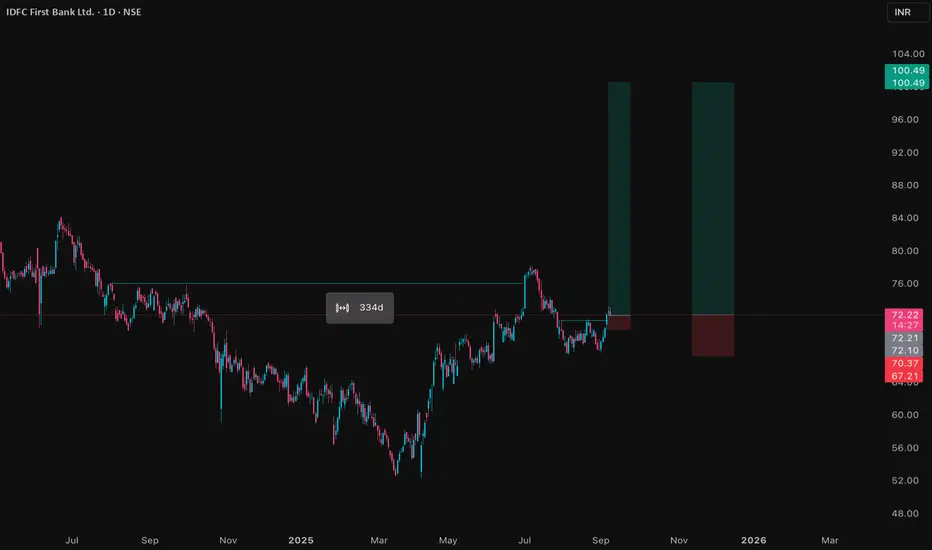
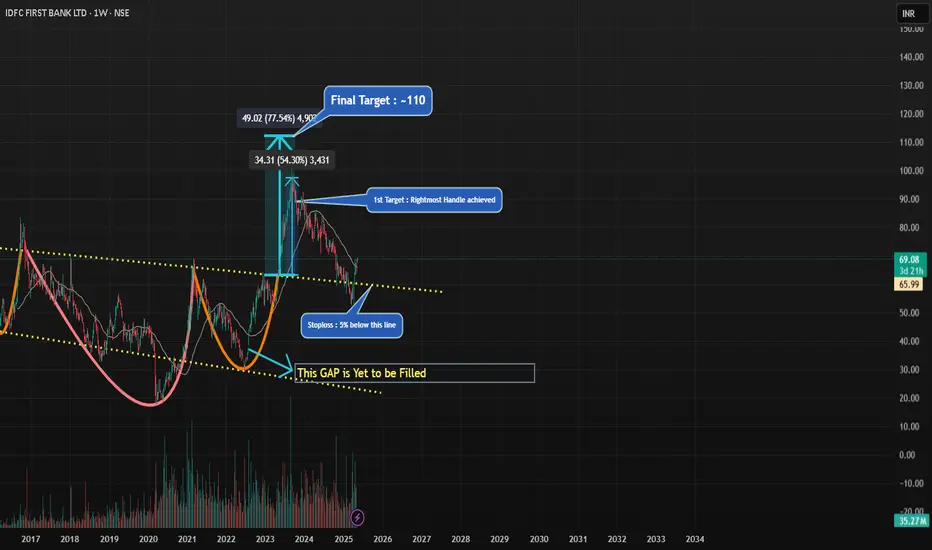
IDFC First Bank : ~70% upside is waitingIts best to select your stocks based on company bussiness (Check Q-o-Q & Y-o-Y sells, profit, debt level, NPA if bank/nbfc).
I believe in buy & hold good stocks (as per above parameters) having favorable technical pattern and sell once target is achieved.
So I keep my stolosses really deep and don`t believe in frequent entry and exit in stocks based on stoplosses .
Target & Stoploss are mentioned on the self explanatory chart .
Please feel free to comment or share your views on my analysis .
Note : I am not SEBI registered advisor . Please consider my analysis for education purpose only .
Option TradingIf you're looking for a simple options trading definition, it goes something like this: Options trading gives you the right or obligation to buy or sell a specific security on or by a specific date at a specific price. An option is a contract that's linked to an underlying asset, such as a stock or another security.

RSI MeaningRSI stands for Relative Strength Index. It's a technical indicator used in financial markets to measure the speed and magnitude of recent price changes, helping traders identify potential overbought or oversold conditions. The RSI, developed by J. Welles Wilder Jr., typically ranges from 0 to 100. A value above 70 generally suggests an asset is overbought, while a value below 30 may indicate it's oversold.

Option and Database TradingIn financial markets, options trading refers to buying and selling contracts that give the holder the right, but not the obligation, to buy or sell an underlying asset (like a stock, index, or ETF) at a specific price (strike price) within a certain time frame. Database trading, on the other hand, involves the buying and selling of data assets or the rights to use specific datasets, often for financial or commercial purposes.

RSI DivergenceRSI: Divergence appears when the RSI's highs or lows diverge from price. For example, if the price makes new lows but the RSI bottoms at higher levels, it signals bullish divergence; if the price makes new highs but the RSI peaks at lower levels, it signals bearish divergence.

Technical class 1In trading, "technical" refers to the practice of analyzing historical price and volume data to identify patterns and predict future price movements. This approach, called technical analysis, is a way to evaluate securities and forecast their behavior based on charts and statistical data.

Database Trading part 3InfluxDB is a high-performance, purpose-built time-series database designed for real-time analytics. It boasts low-latency writes, efficient storage, and a powerful query engine tailored for event-driven systems like algorithmic trading.
