How we trade in option chain ?To trade using an option chain, you first need to understand its structure and the information it provides. Option chains are organized by strike prices, expiration dates, and whether they are call or put options. You then decide whether to buy (long) or sell (short) a particular option contract, specifying the strike price, expiration date, and quantity. Finally, you submit your order through your brokerage platform.
IDFCFIRSTB trade ideas

Explanation of RSIThe Relative Strength Index (RSI) is a momentum indicator in technical analysis that measures the magnitude of recent price changes to assess whether an asset is overbought or oversold. It oscillates between 0 and 100, with values above 70 often suggesting overbought conditions and values below 30 indicating oversold conditions.

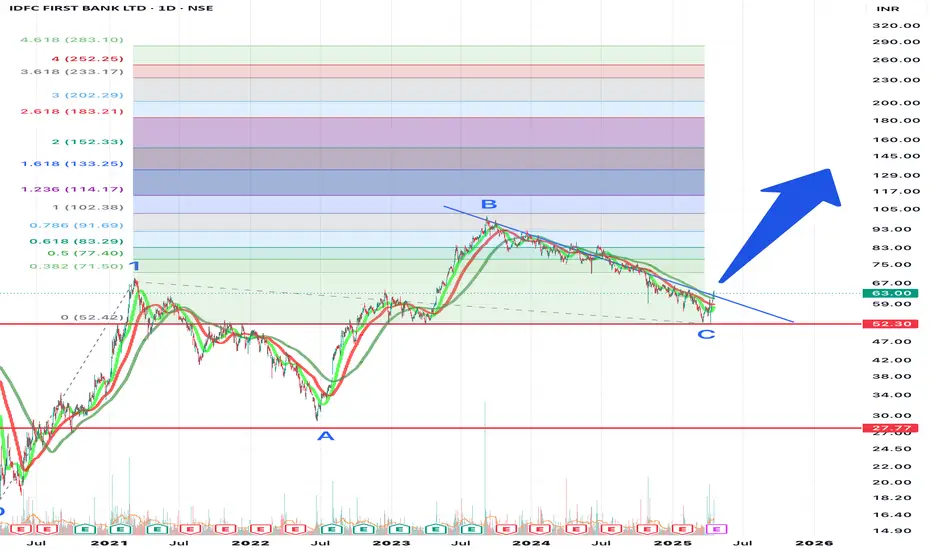
IDFC Elliot wave count (updated)IDFC First bank has a peculiar wave count. A wave was 61.2% of wave 1. Wave B was 161.6% of wave A. Wave C is 61.8% of wave B. I did not mark B as another sub wave 1 as it clearly looked three waves. Wave C low aligns with Wave 1 low and wave A low.
The target for Wave 3 using the channel extension is shown (as minimum) by this year. Looks like If time gets extended to complete wave 3 then wave 3 targets also gets extended.
Is this setup possible? Not sure of the counts. I am using logarithmic scale.

IDFC bank strange Elliot wave count IDFC First bank seem to have a peculiar wave count. A wave was 61.2% of wave 1. Wave B was 161.6% of wave A. Wave C is 61.8% of wave B. I did not mark B as another sub wave 1 as it clearly looked three waves. Is this setup possible?
Database TradingIn trading, "database" refers to the collection and organization of market data, used for analysis and decision-making. This data, often including real-time quotes, historical prices, and other relevant information, is stored and managed within a database system for efficient retrieval and manipulation.

Advanced Database TradingIn trading, "database" refers to the collection and organization of market data, used for analysis and decision-making. This data, often including real-time quotes, historical prices, and other relevant information, is stored and managed within a database system for efficient retrieval and manipulation.

PCR (PUT and CALL) RatioThe Put-Call Ratio (PCR) is a popular technical indicator used by investors to assess market sentiment. It is calculated by dividing the volume or open interest of put options by call options over a specific time period. A higher PCR suggests bearish sentiment, while a lower PCR indicates bullish sentiment.

Option and Database TradingOption trading involves buying or selling contracts that grant the right, but not the obligation, to buy (call option) or sell (put option) an underlying asset at a specific price within a certain time frame. It's a form of derivative trading, where the value of the option is linked to the price of the underlying asset, such as stocks, indices, or ETFs.

IDFC FIRST BANK NEXT 48-36IDFC FIRST BANK NEXT 48-36
: The bank's share price dipped after its Q4FY25 business update, reversing some previous gains. However, it has delivered multibagger returns of 195% over five years

IDFC First Bank Be Ready For Rs 50 To Rs 55**IDFC First Bank** is a private sector bank in India, formed in **2018** after the merger of **IDFC Bank and Capital First**. It offers a range of banking services, including **retail banking, wholesale banking, and asset management**. The bank focuses on consumer loans, MSME financing, and infrastructure lending. Known for its **customer-friendly digital services** and competitive interest rates, IDFC First Bank has rapidly expanded its presence in India's banking sector. While it is a significant player in the industry, **it is not currently a part of the Bank Nifty index**, which includes only the top 12 most liquid and large-cap banking stocks.

IDFCFIRSTB - Bullish inverted head and shoulders1. IDFCFIRST - Bullish inverted head and shoulders pattern
2. Favourable Risk:Reward ratio
3. Price at strong uptrend line
4. Price is also at the neckline of the H&S pattern

IDFC First BankIDFC First Bank Trade Setup - Key Levels to Watch! 📊🚀
Stock: IDFC First Bank Ltd (NSE)
Timeframe: 1D Chart
Current Price: ₹58.39
Entry Level: ₹56.45 - ₹57.18
Stoploss: Below trendline break
Again Entry 51 Around.. 3 to% Stoploss
🎯 Bullish Targets:
✅ ₹66.23 (Breaking Range)
✅ ₹75.16
✅ ₹86.30 (Final Target)
🔻 Bearish Breakdown Levels:
⚠ Trendline breakdown → Next major support at ₹51

IDFC FIRST BANK - TECHNICAL#idfcfirstbank is an Indian private sector bank based in Mumbai, known for its wide range of banking services including personal banking, loans, accounts, cards, and investments. Here are some key levels in the chart about the bank #BankNifty #Nifty #renderwithme
IDFC Bank15 MONTH RALLY
15 MONTH CORRECTION
15 MONTH RALLY
NOW CAN WE Expect 15 months to be 2X returns ????
Perfect Fibonaci levels on 0.786 previous Instance leads to 2X returns
Again Golden Ratio of .681 Now
Can we expect this stock till 130+++ levels

An Inverted Head and Shoulder Trade in IDFC First BankAn Inverted Head and Shoulder pattern is observed in IDFC First Bank.
Trade can be initiated once the recent high is getting broken.Trade details are given in Chart.

Wave Pattern Unfolding Example I have Made an efforts in Explaining the Current Pattern as per wave theory
I have also Explained How to confirm using Price based Measurement so that we get more
confirmation on our Methods we follow in the Market
The ideal patterns shown in the Text book differ in the market due to variation in participants
behavior, most pattern do give an ideal clue .
I hope you like this explanation if Yes please hit the like button and share it with other
If you have Questions please comment i will try to address it
Thanks

Planning your pension plan?-IDFC FIRSTEntry nearest to yellow line. This company can go beyond HDFC in long run. You may buy and keep it for retirement or children.

IDFC FIRST BANK by KRS Charts5th Nov 2024 / 2:34 PM
Why IDFCFIRSTB ❓❓
1. First thing BULLS COUNTER ATTACK visible after correction.
2. Previous Gap got filled last Candle.
3. On higher TF Price is at Old Support zone.
4. Swing Entry Due to B.C. Attack setup what it means, mentioned in Chart.
Target - 86 Rs & 100 Rs.
SL 1D Closing - 63.80 Rs.

IDFC FIRST BANK LONGTERM GAMEIDFC FIRST BANK one of my long term stock list in the "Multi Bagger" Basket. Recently it pass the multiple analysis, FVG Monthly, CUP n HANDLE pattern, BREAKOUT Retest. In terms of Technically. Also fundamentals are good. In next 10 years second level Bank has the good growth when compared to the leading banks.

MY first choice IDFC FIRST BANK IDFC FIRST BANK have previous records and pattern and that repeat again
Technical points
1 - down rising channel
2- Strong support on bottom
3 - hold the top of fab. point
4 previous bull run was came when is go down in channel pattern
First channel performance
Date 31-jan-2022 to 6-dec-2022
first reached on top of 50 and came down 28 in the channel when given reversal to 62
second channel performance
6-dec-2022 to 5-sep-2023
on the top of 62 he came down and reached 52 and than get reversal and make top of 100
third 6-sep-2023 to 27-november today
now its reached at same price of 62 and create bottom now we looking for a fresh reversal and channel breakout
First TRG - 86
Second TRG -98 & 102
Third TRG 120 and above 140
SL 48
only for the long term time duration minimum 1 year

IDFC First Bank LtdIDFC First Bank Ltd
Cmp 64 Sl 55
Tar open
Trend Line Support is seen at 60 in monthly Chart

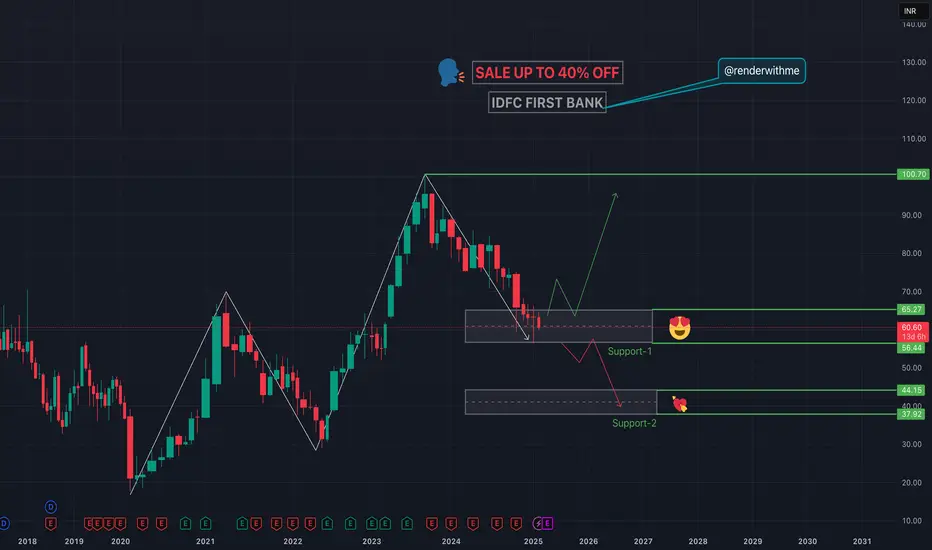
IDFC first bank inverted head & shoulder view- first breakout failed at the range of 82
- 2nd breakout failed at the range of 70
- crossed below the parallel channel midline (range 70)
- Oct monthly candle already touched pivot S1 due to market correction.
- In case monthly pivot S1 does not support. This fall might continue
important zone for accumulation / fib golden ratio 61.80 / range below 59-50
I don't recommend taking trade based on this idea.
consult your SEBI registered adviser to Know the market risk before trade.
in.tradingview.com/pricing/?share_your_love=johnbritto2088

IDFCfirst Bank CUP & Handle Breakout RetestHello Everyone,
HDFC First Bank making Retest from Cup & handle Chart pattern Breakout restest with trendline also taking Support of 200ema.
Fibbo 61% retracement completed and rsi oversold with making repeated pattern as earlier.Stock price cmp 66 is 34% down from lifetime high of 100.
